Hi all,
I am a newbie to elasticsearch, and I have an issue with my ES cluster.d).
“Something” triggers one of the data nodes to do an extensive old GC which lasts for a few minutes. During this GC’ing the master node marks the data node offline (which puts the cluster into the yellow state), the 2 other data nodes then start to replicated shards for redundancy. Once the offline data node finishes GC’ing, the master node sees it again, and then all 3 data nodes start to re-balance. I’d say the cluster is maybe yellow for a few minutes. It takes approx 15 minutes for the cluster to have 3 data nodes balanced.
At the moment I am not sure what this “something” is, but would like some assistance (if possible) in tying to understand if there is anything cluster side I can do.
Initially we did have only 2 data nodes, and recently (last 2-3 weeks) have added a new data node. When we had only 2 data nodes, the old gc’ing would only take maybe 12 seconds (always under 30 seconds), it would never cause the cluster to go yellow. Since we scaled out by adding 1 extra data node, we notice that when ever we have issues, we see at least one data node running an old gc scan, which lasts a few minutes.
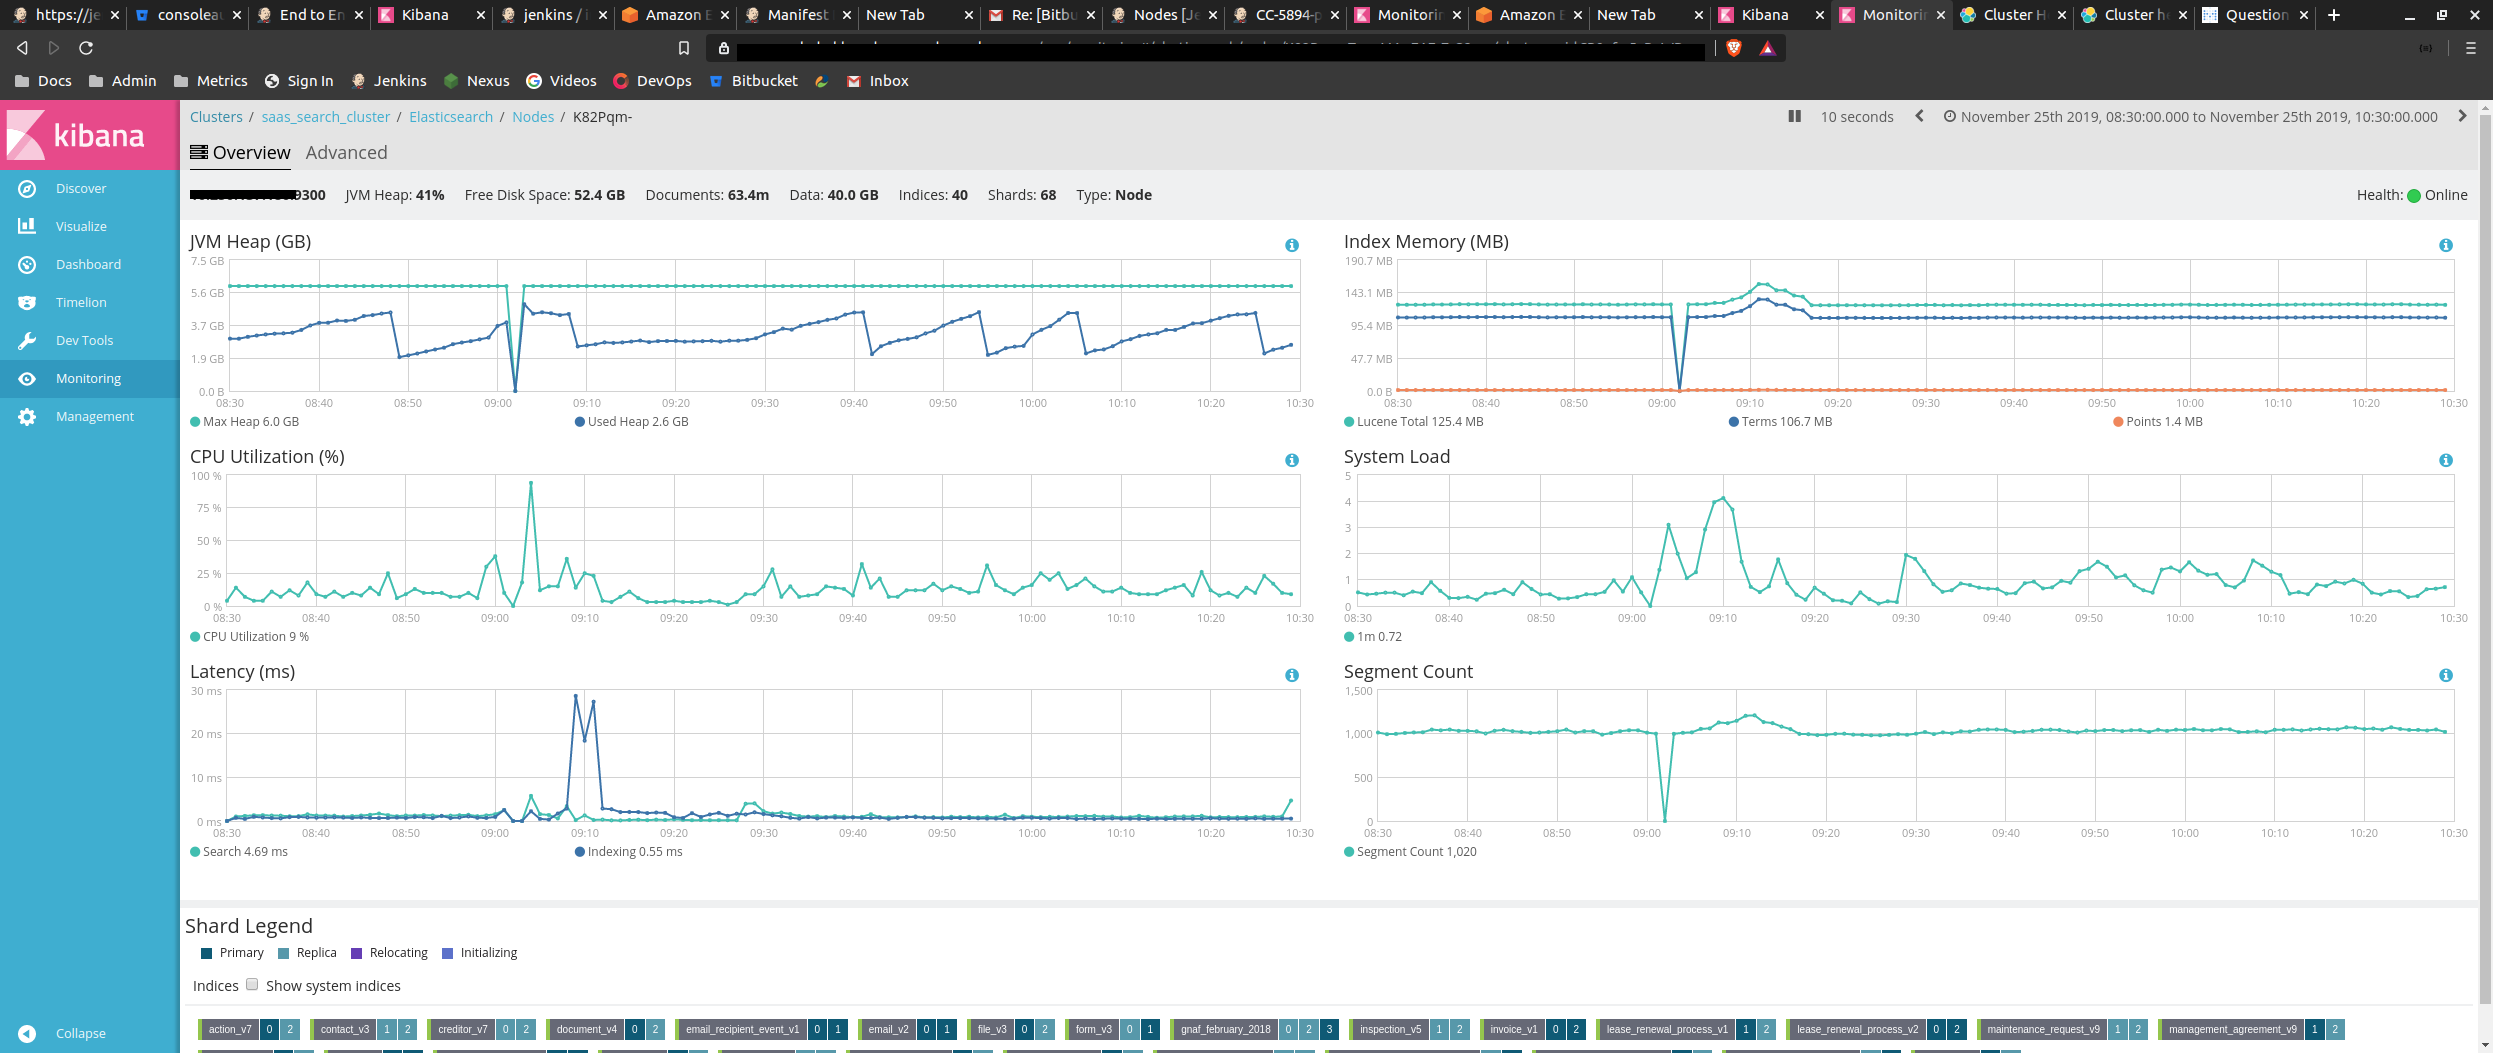
During this issue, datanode (Mcu9vw9) was marked as unavailable.
This is the view via kibana monitoring:
This is the GC collection that i see on the data node
[2019-11-24T23:03:58,807][WARN ][o.e.m.j.JvmGcMonitorService] [MCu9vw9] [gc][old][908655][186] duration [2.1m], collections [1]/[2.2m], total [2.1m]/[7.4m], memory [4.9gb]->[1.5gb]/[5.9gb], all_pools {[young] [498.2kb]->[9.9mb]/[266.2mb]}{[survivor] [33.2mb]->[0b]/[33.2mb]}{[old] [4.9gb]->[1.5gb]/[5.6gb]}
We are running rather old elasticsearch products (5.6.16), planning is in progress to upgrade.
Java is AWS Corretto 8_232
Hi @Newbie2019
A common source of very long garbage collections is the system swapping. Did you turn off swap on your data-nodes as suggested in the ES documentation here?
Thanks Armin_Braun for your time to answer. So its fair to assume that a 2+ minute garbage collection is deemed as being very long.
We run elasticsearch in containers. When inspecting the container we are passing the container "bootstrap.memory_lock=true" via an environment variable (not via the elasticsearch.yml), I do not think the application is using this. I am going to add this to the elasticsearch.yml file.
We used to use the official elastic docker image, so when we passed "bootstrap.memory_lock=true" as a environment variable it worked. Earlier this year we decided to use our own custom base images, and built elastic on top of our base image. I think when this was done, the environment variable "bootstrap.memory_lock=true" was left in the Dockerfile, but is no longer handled.
I was able to confirm that our current set up did not have the memory_lock set to true using command GET _nodes?filter_path=**.mlockall in DevTools in kibana.
I will be getting this fix out over the next few days, and will update if we have no issues for over a week.
Update:
The change was been pushed out to production. Its been about 36 hours and the application has not had any issues. Which is a result as we were having issues daily.
Since the change, I am still seeing GC related log entries, and we had had some GC's that last 2 seconds, I see this when we do a reindex.
Example from data node after the change
[2019-11-28T04:38:48,939][WARN ][o.e.m.j.JvmGcMonitorService] [MCu9vw9] [gc][66906] overhead, spent [2.2s] collecting in the last [2.7s]
This entry does not say its an OLD gc, but according the GC graphs in kibana it is. When this happens, no issues have been reported.
If I compare the above log entry to one from the cluster when there was 120 second GC:
[2019-11-24T23:03:58,807][WARN ][o.e.m.j.JvmGcMonitorService] [MCu9vw9] [gc][old][908655][186] duration [2.1m], collections [1]/[2.2m], total [2.1m]/[7.4m], memory [4.9gb]->[1.5gb]/[5.9gb], all_pools {[young] [498.2kb]->[9.9mb]/[266.2mb]}{[survivor] [33.2mb]->[0b]/[33.2mb]}{[old] [4.9gb]->[1.5gb]/[5.6gb]}
It looks different. I am trying to understand the difference between the 2 GCs. Any pointers would be much appreciated.
Hi @Newbie2019
the difference between the first warning logged and the second warning logged is this:
The first warning simply states, that out of the last 2.7s, a total of 2.2s was spent on GC. It does not mean, that you saw an individual garbage collection take 2.2s however.
The second warning though, that informed you about a garbage collection that took 2.1m outright, blocking your JVM from properly functioning.
If you're only seeing the first warning during special high-load situations like running a reindex, that's not necessarily something to worry about since it does not mean any node was completely blocked for 2s.
Thanks for clarifying this.
There have been no issues with the cluster since adding the memory changes.
Thanks again for your help.
On with the upgrade now