I got mine working by adding this
"geoip"  : {
  "dynamic": true,
  "properties" : {
    "ip": { "type": "ip" },
    "location" : { "type" : "geo_point" },
    "latitude" : { "type" : "half_float" },
    "longitude" : { "type" : "half_float" }
  }
}
to my filebeat.template.json file. After I refreshed the filebeat index pattern everything began to pickup properly
runtman
July 18, 2017, 8:38am
22
Interesting, I have the following and it doesn't work.
            "geoip": {
              "properties": {
                "continent_name": {
                  "ignore_above": 1024,
                  "type": "keyword"
                },
                "country_iso_code": {
                  "ignore_above": 1024,
                  "type": "keyword"
                },
                "location": {
                  "type": "geo_point"
                }
                "latitude": {
                  "type": "half_float"
                }
                "longitude": {
                  "type": "half_float"
                }
              }
            },
I find it strange that I never have a field for "location" only ever "geoip.location.lon" "geoip.location.lat"
I must admit I got fed up with this and stopped troubleshooting it, even with a fresh install I have this problem.
warkolm
July 18, 2017, 8:45am
23
That means that there is something populating those fields instead of geoip.longitude and geoip.latitude and geoip.location, which are what is defined in the template/mapping.
runtman
July 18, 2017, 9:04am
24
I understand, but how?
I have posted the template, I have loaded the template and I have refreshed fields.
The only host sending logs to "filebeat-*" right now is the one using this prospector setup.
- input_type: log
  paths:
    - /var/log/nginx/webdev/error.log
  document_type: nginx.error
  tags: ["nginx_webdev"]

- input_type: log
  paths:
    - /var/log/*.log
  document_type: generic_log
  tags: ["generic_log"]

- input_type: log
  paths:
    - /var/log/syslog
  document_type: syslog
  tags: ["syslog"]

- input_type: log
  paths:
    - /var/log/nginx/training/error.log
  document_type: nginx.error
  tags: ["nginx_training"]

- input_type: log
  paths:
    - / /var/log/nginx/dev/error.log
  document_type: nginx.error
  tags: ["nginx_dev"]

- input_type: log
  paths:
    - /var/log/nginx/webdev/access.log
  document_type: nginx.access
  tags: ["nginx_webdev"]

- input_type: log
  paths:
    - /var/log/nginx/dev/access.log
  document_type: nginx.access
  tags: ["nginx_dev"]

- input_type: log
  paths:
    - /var/log/nginx/training/access.log
  document_type: nginx.access
  tags: ["nginx_training"]

- input_type: log
  paths:
    - /var/log/nginx/analytics18/access.log
  document_type: nginx.access
  tags: ["nginx_a18"]

- input_type: log
  paths:
    - /var/log/nginx/analytics18/error.log
  document_type: nginx.error
  tags: ["nginx_a18"]

- input_type: log
  paths:
    - /var/log/nginx/*.log
  document_type: nginx
  tags: ["nginx_base"]
Logstash
filter {
        if [type] == "nginx.access" {
                grok {
                        match => { "message" => "%{HTTPD_COMBINEDLOG}" }
                }
                geoip {
                        source => "clientip"
                }
        }
        if [type] == "nginx.error" {
                grok {
                        match => { "message" => "%{HTTPD20_ERRORLOG}" }
                }
                geoip {
                        source => "clientip"
                }
        }
        if [type] == "nginx" {
                grok {
                        match => { "message" => "%{HTTPD_COMBINEDLOG}" }
                }
                geoip {
			source => "clientip"
		}
        }
}
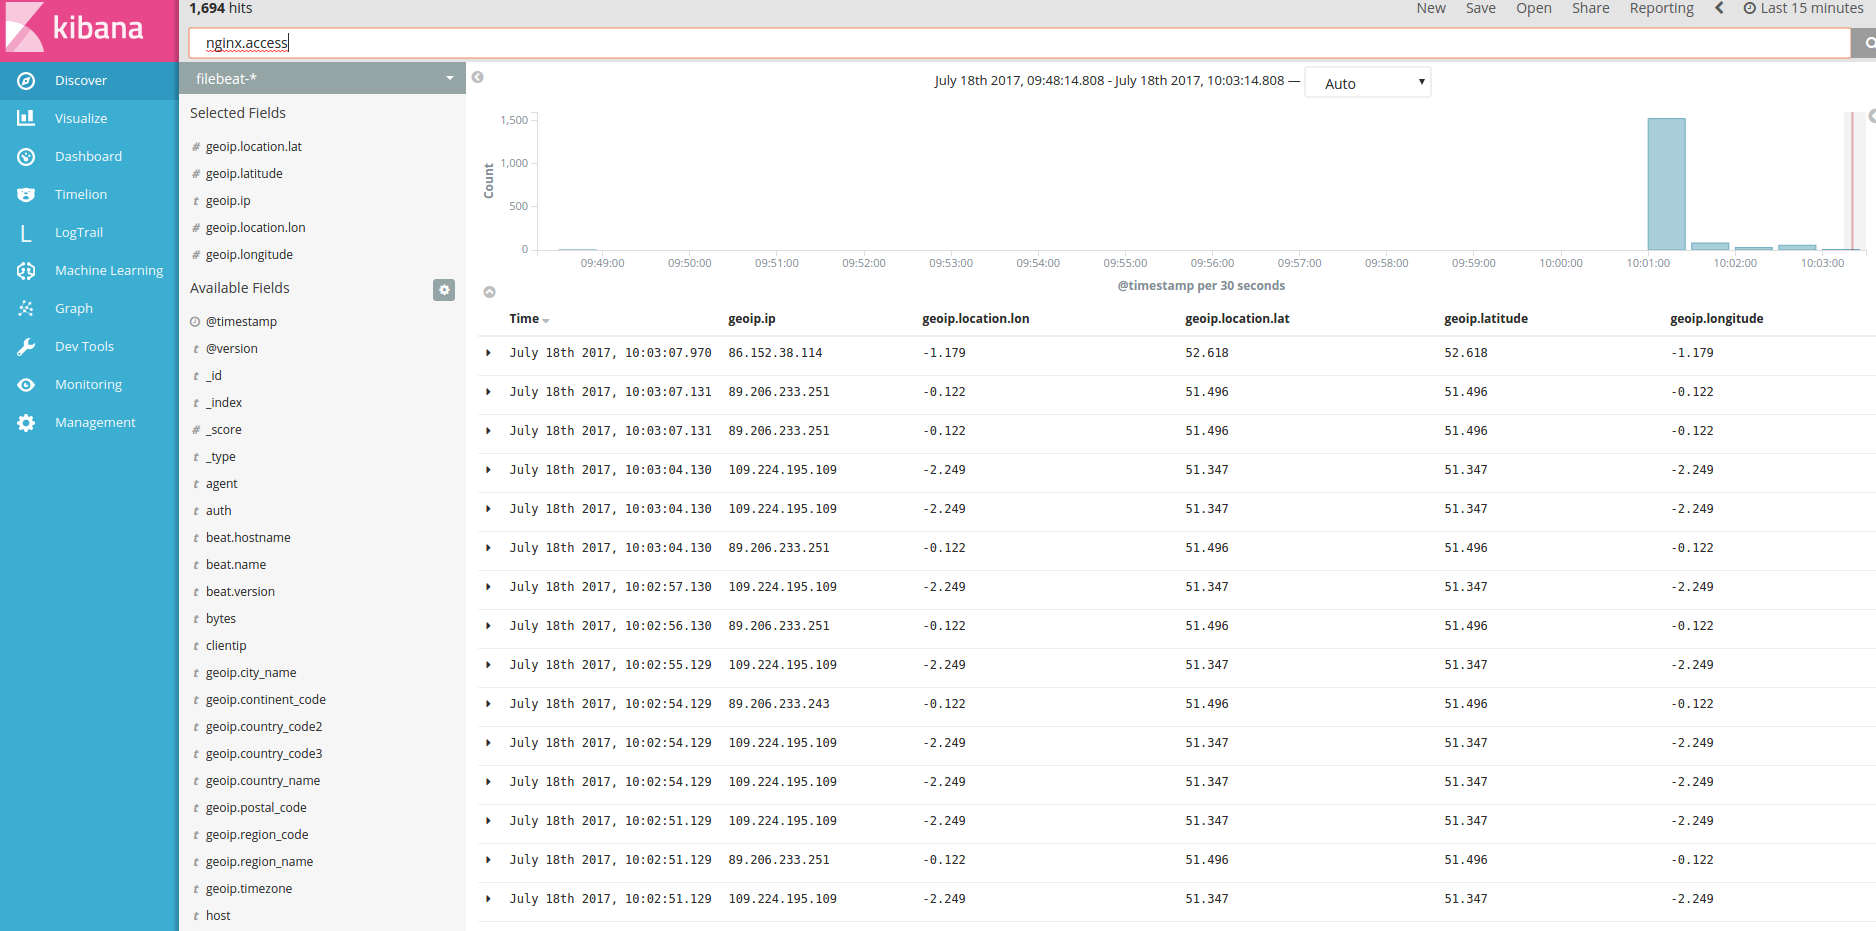
Example of what I am seeing.
warkolm
July 18, 2017, 9:07am
25
Ok, well which type has this incorrect data?
runtman
July 18, 2017, 9:10am
26
I would say neither have incorrect data, but from earlier in this thread you stated I needed to see the field geoip.location, which I don't have.
This is my issue here
I get 4 options there, none of which plot to the graph.
warkolm
July 18, 2017, 9:12am
27
Yep understand.
But you have geoip.location.longitude and geoip.location.latitude, so which of the types in your Logstash config is generating these fields - nginx.access, nginx.error, nginx.
runtman
July 18, 2017, 9:15am
28
nginx.access
Is this what you mean? The only relevant configs have already been shared.
warkolm
July 18, 2017, 9:21am
29
Yep
There is no geoip.location.longitude or geoip.location.latitude in the pattern you are using in the grok, so there has to be something else that is creating these from your config somewhere. Can you share the entire config, even via PM?
runtman
July 18, 2017, 9:28am
30
Configs have been supplied via a PM (Already shared in an earlier post)
I think if you add the snippet to your json template and re-upload it you should have success. I added it around line 272.
runtman
July 18, 2017, 3:27pm
32
Sorry? I posted earlier that I already had the vars in the snippet you posted.
Interesting, I have the following and it doesn't work.
"geoip": {
"properties": {
"continent_name": {
"ignore_above": 1024,
"type": "keyword"
},
"country_iso_code": {
"ignore_above": 1024,
"type": "keyword"
},
"location": {
"type": "geo_point"
}
"latitude": {
…
The only missing parameter was "dynamic" i will try to add that now.
runtman
July 20, 2017, 7:41am
34
Thanks for that, I have run through that and have the same outcome, it's not plotting the graph.
runtman
July 27, 2017, 10:34am
35
This is interesting.
I removed my nginx filters, and stopped passing nginx logs.
Added the following syslog grok
filter {
  if [type] == "syslog" {
    if [message] =~ /last message repeated [0-9]+ times/ {
      drop { }
    }
    grok {
      match => { "message" => "%{SYSLOGTIMESTAMP:syslog_timestamp} %{SYSLOGHOST:syslog_hostname} %{DATA:syslog_program}(?:\[%{POSINT:syslog_pid}\])?: %{GREEDYDATA:syslog_message}" }
      add_field => [ "received_at", "%{@timestamp}" ]
      add_field => [ "received_from", "%{host}" ]
    }
    geoip {
      source => "[system][auth][ssh][ip]"
      target => "[system][auth][ssh][geoip]"
    }
Almost immediately, I had the following field available:
system.auth.ssh.geoip.location
So I am assuming, my filter for nginx needs tweaking?
runtman
July 28, 2017, 1:15pm
36
Stopped using the ansible code deployed by elasticsearch them selves, installed everything manually and I still have the issues.
Installed ES on 1 node.
What am I missing here?
The logs pass any grok I give to it, and as per
https://grokdebug.herokuapp.com/
%{COMBINEDAPACHELOG}+%{GREEDYDATA:extra_fields}

109.224.195.109 - - [27/Jul/2017:10:38:06 +0000] "PUT /hq/ae/devTes/agent_group/001499349052081797 HTTP/1.1" 201 148 "-" "python-requests/2.11.0"