Looking for some pointers on how to optimize our use of top_children.
Scenario: ~800K parent docs, ~40 million child docs, running version 0.19.8
on EC2
In the docs, there is a warning about memory:
With the current implementation, all _id values are loaded to memory (heap)
in order to support fast lookups, so make sure there is enough mem for it.
We definitely have enough heap allocated to fit the parent _ids (-Xms4993m
-Xmx9986m) but what we have been noticing is that the first few queries
will take several minutes (7, 8 or more) to complete. Our guess is that it
takes time to populate the cache, which is understandable. After that we
are able to see second or sub-second responses across a random array of
keywords (we also set "factor" really high to maximize our chances of
finding all matching parent docs).
The issue is that this "cache" (which is really a Map
in TopChildrenQuery.java) gets cleared periodically (GC maybe?) and we have
to start over on re-populating the parent _ids. This means that some users
could be faced with these extremely long query times.
Questions:
Is there a way to somehow pre-populate the parent _id cache so that
users never get faced with these long queries? A straight forward approach
would be to have an outside cron process that keeps sending queries
periodically to keep the ids in memory. Does that sound reasonable is there
a better way? For instance, could the Index Warmup APIhttps://github.com/elasticsearch/elasticsearch/issues/1913 be
of use here?
How could we reduce the time it takes for the first queries to run?
Any pointers would be great. Thank you in advance for your time.
The warmer api can warm the parent_id cache and other caches such as
field data cache (used during faceting and sorting).
If you put a query that holds a topchildren query then this query will
be executed automatically after a refresh for a new index segment.
I think this the approach is preferable in your case, since the
warming query is executed during a refresh. That way a user searching
isn't bothered with queries that can take a long time to executed.
The parent_id cache is kept per index segment. The parent_id cache is
cleared up after a segment has been merged away. Warming queries
only trigger parent_id cache populations for new segments.
Looking for some pointers on how to optimize our use of top_children.
Scenario: ~800K parent docs, ~40 million child docs, running version 0.19.8
on EC2
In the docs, there is a warning about memory:
With the current implementation, all _id values are loaded to memory
(heap) in order to support fast lookups, so make sure there is enough mem
for it.
We definitely have enough heap allocated to fit the parent _ids (-Xms4993m
-Xmx9986m) but what we have been noticing is that the first few queries will
take several minutes (7, 8 or more) to complete. Our guess is that it takes
time to populate the cache, which is understandable. After that we are able
to see second or sub-second responses across a random array of keywords (we
also set "factor" really high to maximize our chances of finding all
matching parent docs).
The issue is that this "cache" (which is really a Map in
TopChildrenQuery.java) gets cleared periodically (GC maybe?) and we have to
start over on re-populating the parent _ids. This means that some users
could be faced with these extremely long query times.
Questions:
Is there a way to somehow pre-populate the parent _id cache so that users
never get faced with these long queries? A straight forward approach would
be to have an outside cron process that keeps sending queries periodically
to keep the ids in memory. Does that sound reasonable is there a better way?
For instance, could the Index Warmup API be of use here?
How could we reduce the time it takes for the first queries to run?
Any pointers would be great. Thank you in advance for your time.
Thanks Martijn, this helps. We can switch to trunk and run some tests with
the Warmer API to see what mileage we get.
I do have one follow up question if you have time: "The parent_id cache
is cleared up after a segment has been merged away"; are you referring to
the cumulative parent_id caches across all segments or only the cache of
the segment that gets merged away? If it's the cumulative cache, then that
would mean that regardless of the warmer api usage, each time the merge
scheduler kicks-in to merge segments our users would see the slow queries,
no?
We have been running an experiment on QA over the last 24 hours where we
have a top_children query with a different keyword executed every 5
minutes. It seems that with our QA setup at least, every 8 to 9 hours, the
slow queries come back on their own. Could that be caused by the merges
then?
Thanks again for taking the time to respond.
-GS
On Monday, July 30, 2012 7:06:00 AM UTC-4, Martijn v Groningen wrote:
Hi George,
The warmer api can warm the parent_id cache and other caches such as
field data cache (used during faceting and sorting).
If you put a query that holds a topchildren query then this query will
be executed automatically after a refresh for a new index segment.
I think this the approach is preferable in your case, since the
warming query is executed during a refresh. That way a user searching
isn't bothered with queries that can take a long time to executed.
The parent_id cache is kept per index segment. The parent_id cache is
cleared up after a segment has been merged away. Warming queries
only trigger parent_id cache populations for new segments.
Martijn
On 27 July 2012 22:19, George Stathis wrote:
Looking for some pointers on how to optimize our use of top_children.
Scenario: ~800K parent docs, ~40 million child docs, running version
0.19.8
on EC2
In the docs, there is a warning about memory:
With the current implementation, all _id values are loaded to memory
(heap) in order to support fast lookups, so make sure there is enough
mem
for it.
We definitely have enough heap allocated to fit the parent _ids
(-Xms4993m
-Xmx9986m) but what we have been noticing is that the first few queries
will
take several minutes (7, 8 or more) to complete. Our guess is that it
takes
time to populate the cache, which is understandable. After that we are
able
to see second or sub-second responses across a random array of keywords
(we
also set "factor" really high to maximize our chances of finding all
matching parent docs).
The issue is that this "cache" (which is really a Map in
TopChildrenQuery.java) gets cleared periodically (GC maybe?) and we have
to
start over on re-populating the parent _ids. This means that some users
could be faced with these extremely long query times.
Questions:
Is there a way to somehow pre-populate the parent _id cache so that
users
never get faced with these long queries? A straight forward approach
would
be to have an outside cron process that keeps sending queries
periodically
to keep the ids in memory. Does that sound reasonable is there a better
way?
For instance, could the Index Warmup API be of use here?
How could we reduce the time it takes for the first queries to run?
Any pointers would be great. Thank you in advance for your time.
I do have one follow up question if you have time: "The parent_id cache is
cleared up after a segment has been merged away"; are you referring to the
cumulative parent_id caches across all segments or only the cache of the
segment that gets merged away? If it's the cumulative cache, then that would
mean that regardless of the warmer api usage, each time the merge scheduler
kicks-in to merge segments our users would see the slow queries, no?
I'm referring to the cache of the segment that gets merged away. Warming happens
during the refresh operation. Therefore search requests should never
encounter an
empty parent_id cache.
We have been running an experiment on QA over the last 24 hours where we
have a top_children query with a different keyword executed every 5 minutes.
It seems that with our QA setup at least, every 8 to 9 hours, the slow
queries come back on their own. Could that be caused by the merges then?
Have you configured warming queries on QA? How often is the index updated
on QA? How much of the Java heap space is utilized when the slow queries occur?
There could be a different reason why QA is periodically slow.
On Tuesday, July 31, 2012 4:49:03 AM UTC-4, Martijn v Groningen wrote:
Hi GS,
I do have one follow up question if you have time: "The parent_id cache
is
cleared up after a segment has been merged away"; are you referring to
the
cumulative parent_id caches across all segments or only the cache of the
segment that gets merged away? If it's the cumulative cache, then that
would
mean that regardless of the warmer api usage, each time the merge
scheduler
kicks-in to merge segments our users would see the slow queries, no?
I'm referring to the cache of the segment that gets merged away. Warming
happens
during the refresh operation. Therefore search requests should never
encounter an
empty parent_id cache.
Got it, thanks for clarifying Martijn.
We have been running an experiment on QA over the last 24 hours where we
have a top_children query with a different keyword executed every 5
minutes.
It seems that with our QA setup at least, every 8 to 9 hours, the slow
queries come back on their own. Could that be caused by the merges then?
Have you configured warming queries on QA? How often is the index updated
on QA? How much of the Java heap space is utilized when the slow queries
occur?
There could be a different reason why QA is periodically slow.
We are still running 0.19.8 but now that I know that warming can help, I'll
install trunk on QA this week. Our index can be updated at any time in
real-time (depending on user actions) but even more so at night when we run
some batch jobs that bring in new data; during those times, there can be
peaks of several thousand documents per second added. I observed the slow
queries occur during those times which is why I assumed merging. But I
totally hear what you are saying; I'll instrument QA better so that I can
try to correlate JVM and OS activity before I jump to conclusions. I'll
post an update when I have something more tangible.
Cycle through 300 random keywords doing a top_children query every 5
seconds for 60 times (about 25 hours)
Measure response times and mark anything taking over 10 seconds as a
"long" response time
While the test is running, some documents might be added at a random
rate; in this particular example, only 28 docs were indexed within the two
hours preceding the observations below
The results:
After waiting for the first initial queries to warm up the caches,
subsequent queries consistently timed under one second on average
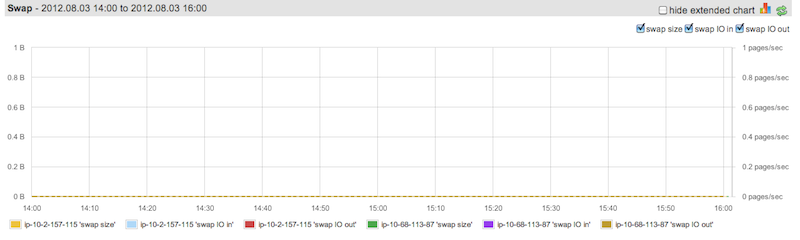
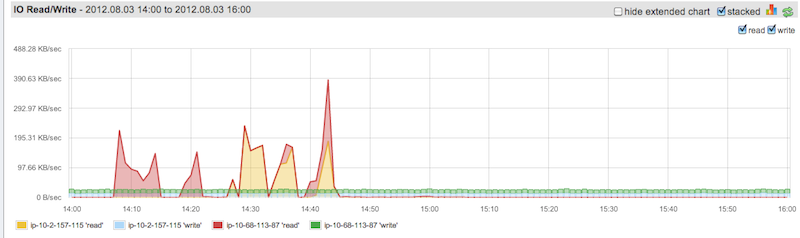
At some point during the test, query response times dropped
precipitously. The numbers are below and screen shots of the server health
stats are attached
It seems that GC is kicking in and pausing the system
A curious observation is that both the filter caches and field caches
drop on their own even though we have not specified an expiration; they
should normally default to -1, i.e. no expiration, right?
Comments:
Testing with the warming API will be next
Still need to test with bootstrap.mlockall
Wondering whether we need to try -XX:+UseG1GC since we are on JDK 7
Do people generally use the default GC settings here or do they tweak to
match their usage profiles? If the latter, what do people look at in terms
of GC to minimize pauses when it comes to supporting real-time search?
Would adding more nodes and shards help?
Looking forward to any feedback.
-GS
Test timings:
03-08-2012 10:07:28 ES Speed Checker INFO - Searching for: sparklingly
03-08-2012 10:07:28 ES Speed Checker INFO - Server time: 4,
03-08-2012 10:07:28 ES Speed Checker INFO - Total time: 22
03-08-2012 10:07:28 ES Speed Checker INFO -
03-08-2012 10:07:33 ES Speed Checker INFO - Searching for: swedish
03-08-2012 10:07:33 ES Speed Checker INFO - Server time: 12,
03-08-2012 10:07:33 ES Speed Checker INFO - Total time: 30
03-08-2012 10:07:33 ES Speed Checker INFO -
03-08-2012 10:07:38 ES Speed Checker INFO - Searching for: vainly
03-08-2012 10:07:38 ES Speed Checker INFO - Server time: 4,
03-08-2012 10:07:38 ES Speed Checker INFO - Total time: 21
03-08-2012 10:07:38 ES Speed Checker INFO -
03-08-2012 10:07:43 ES Speed Checker INFO - Searching for: useable
03-08-2012 10:07:43 ES Speed Checker INFO - Server time: 7,
03-08-2012 10:07:43 ES Speed Checker INFO - Total time: 24
03-08-2012 10:07:43 ES Speed Checker INFO -
03-08-2012 10:07:48 ES Speed Checker INFO - Searching for: queasiness
03-08-2012 10:07:48 ES Speed Checker INFO - Server time: 5,
03-08-2012 10:07:48 ES Speed Checker INFO - Total time: 21
03-08-2012 10:07:48 ES Speed Checker INFO -
03-08-2012 10:07:53 ES Speed Checker INFO - Searching for: handcuffing
03-08-2012 10:07:53 ES Speed Checker INFO - Server time: 5,
03-08-2012 10:07:53 ES Speed Checker INFO - Total time: 22
03-08-2012 10:07:53 ES Speed Checker INFO - 03-08-2012 10:07:58 ES Speed Checker INFO - Searching for: suddenness 03-08-2012 10:14:17 ES Speed Checker INFO - Server time: 378891, 03-08-2012 10:14:17 ES Speed Checker INFO - Total time: 378922 (long)
03-08-2012 10:14:17 ES Speed Checker INFO -
03-08-2012 10:14:22 ES Speed Checker INFO - Searching for: prison
03-08-2012 10:14:22 ES Speed Checker INFO - Server time: 14,
03-08-2012 10:14:22 ES Speed Checker INFO - Total time: 32
03-08-2012 10:14:22 ES Speed Checker INFO - 03-08-2012 10:14:27 ES Speed Checker INFO - Searching for: rationales 03-08-2012 10:20:53 ES Speed Checker INFO - Server time: 385608, 03-08-2012 10:20:53 ES Speed Checker INFO - Total time: 385670 (long)
03-08-2012 10:20:53 ES Speed Checker INFO -
03-08-2012 10:20:58 ES Speed Checker INFO - Searching for: outdoors
03-08-2012 10:20:58 ES Speed Checker INFO - Server time: 13,
03-08-2012 10:20:58 ES Speed Checker INFO - Total time: 82
03-08-2012 10:20:58 ES Speed Checker INFO -
03-08-2012 10:21:03 ES Speed Checker INFO - Searching for: supposedly
03-08-2012 10:21:03 ES Speed Checker INFO - Server time: 243,
03-08-2012 10:21:03 ES Speed Checker INFO - Server time: 8.406484,
03-08-2012 10:21:03 ES Speed Checker INFO - Total time: 260
[...]
03-08-2012 10:27:02 ES Speed Checker INFO - Searching for: platitudes
03-08-2012 10:27:02 ES Speed Checker INFO - Server time: 7,
03-08-2012 10:27:02 ES Speed Checker INFO - Total time: 24
03-08-2012 10:27:02 ES Speed Checker INFO -
03-08-2012 10:27:07 ES Speed Checker INFO - Searching for: necessarily
03-08-2012 10:27:07 ES Speed Checker INFO - Server time: 13,
03-08-2012 10:27:07 ES Speed Checker INFO - Total time: 32
03-08-2012 10:27:07 ES Speed Checker INFO - 03-08-2012 10:27:12 ES Speed Checker INFO - Searching for: rusts 03-08-2012 10:32:25 ES Speed Checker INFO - Server time: 312883, 03-08-2012 10:32:25 ES Speed Checker INFO - Server time: 0.7681017, 03-08-2012 10:32:25 ES Speed Checker INFO - Total time: 312918 (long)
03-08-2012 10:32:25 ES Speed Checker INFO - 03-08-2012 10:32:30 ES Speed Checker INFO - Searching for: collated 03-08-2012 10:37:06 ES Speed Checker INFO - Server time: 275658, 03-08-2012 10:37:06 ES Speed Checker INFO - Total time: 275537 (long)
03-08-2012 10:37:06 ES Speed Checker INFO - 03-08-2012 10:37:11 ES Speed Checker INFO - Searching for: burma 03-08-2012 10:43:40 ES Speed Checker INFO - Server time: 389449, 03-08-2012 10:43:40 ES Speed Checker INFO - Total time: 389475 (long)
03-08-2012 10:43:40 ES Speed Checker INFO -
03-08-2012 10:43:45 ES Speed Checker INFO - Searching for: overthrew
03-08-2012 10:43:45 ES Speed Checker INFO - Server time: 14,
03-08-2012 10:43:45 ES Speed Checker INFO - Total time: 35
03-08-2012 10:43:45 ES Speed Checker INFO -
03-08-2012 10:43:50 ES Speed Checker INFO - Searching for: joys
03-08-2012 10:43:50 ES Speed Checker INFO - Server time: 55,
03-08-2012 10:43:50 ES Speed Checker INFO - Total time: 73
03-08-2012 10:43:50 ES Speed Checker INFO -
03-08-2012 10:43:55 ES Speed Checker INFO - Searching for: keels
03-08-2012 10:43:56 ES Speed Checker INFO - Server time: 10,
03-08-2012 10:43:56 ES Speed Checker INFO - Total time: 29
Well, that was quick. Looks like we have been running
with bootstrap.mlockall=true already (checked the setting
in elasticsearch.yml). Just to be covered, I added it to ES_JAVA_OPTS as
well.
Update: in case it helps anyone else with the same issue, switching to
0.20.0 Beta on master and using the warming queries as Martijn
suggested did the trick. We were able to confirm that during the same
nightly periods of updating the index on our QA environment, the same GC
activity, merges and filter cache size fluctuations occurred as in 0.19.8
but there were no adverse effects on perceived search response times.
-GS
On Friday, August 3, 2012 6:22:28 PM UTC-4, George Stathis wrote:
Well, that was quick. Looks like we have been running
with bootstrap.mlockall=true already (checked the setting
in elasticsearch.yml). Just to be covered, I added it to ES_JAVA_OPTS as
well.
Apache, Apache Lucene, Apache Hadoop, Hadoop, HDFS and the yellow elephant
logo are trademarks of the
Apache Software Foundation
in the United States and/or other countries.