Hi people, I have a Graylog server fulfilled of a lot of network and host logs.
On the other hand, I have a new Elastic SIEM 7.7 implementation and some servers with different beats that point to it.
But I have to direct all Graylog logs to the Elastic SIEM, in order to fulfill this new systen and to have more security events detection and analisys capacity.
Is there any way to send all Gralog logs to my Elastic SIEM?
In GELF output, I can define IP, Port and Protocol of destination SIEM server. When I did that I can see packets arriving to my SIEM, but I can't see them on the GUI.
Good to hear you were able to export your data, now let's see what we can do to get it to start showing up within the SIEM App.
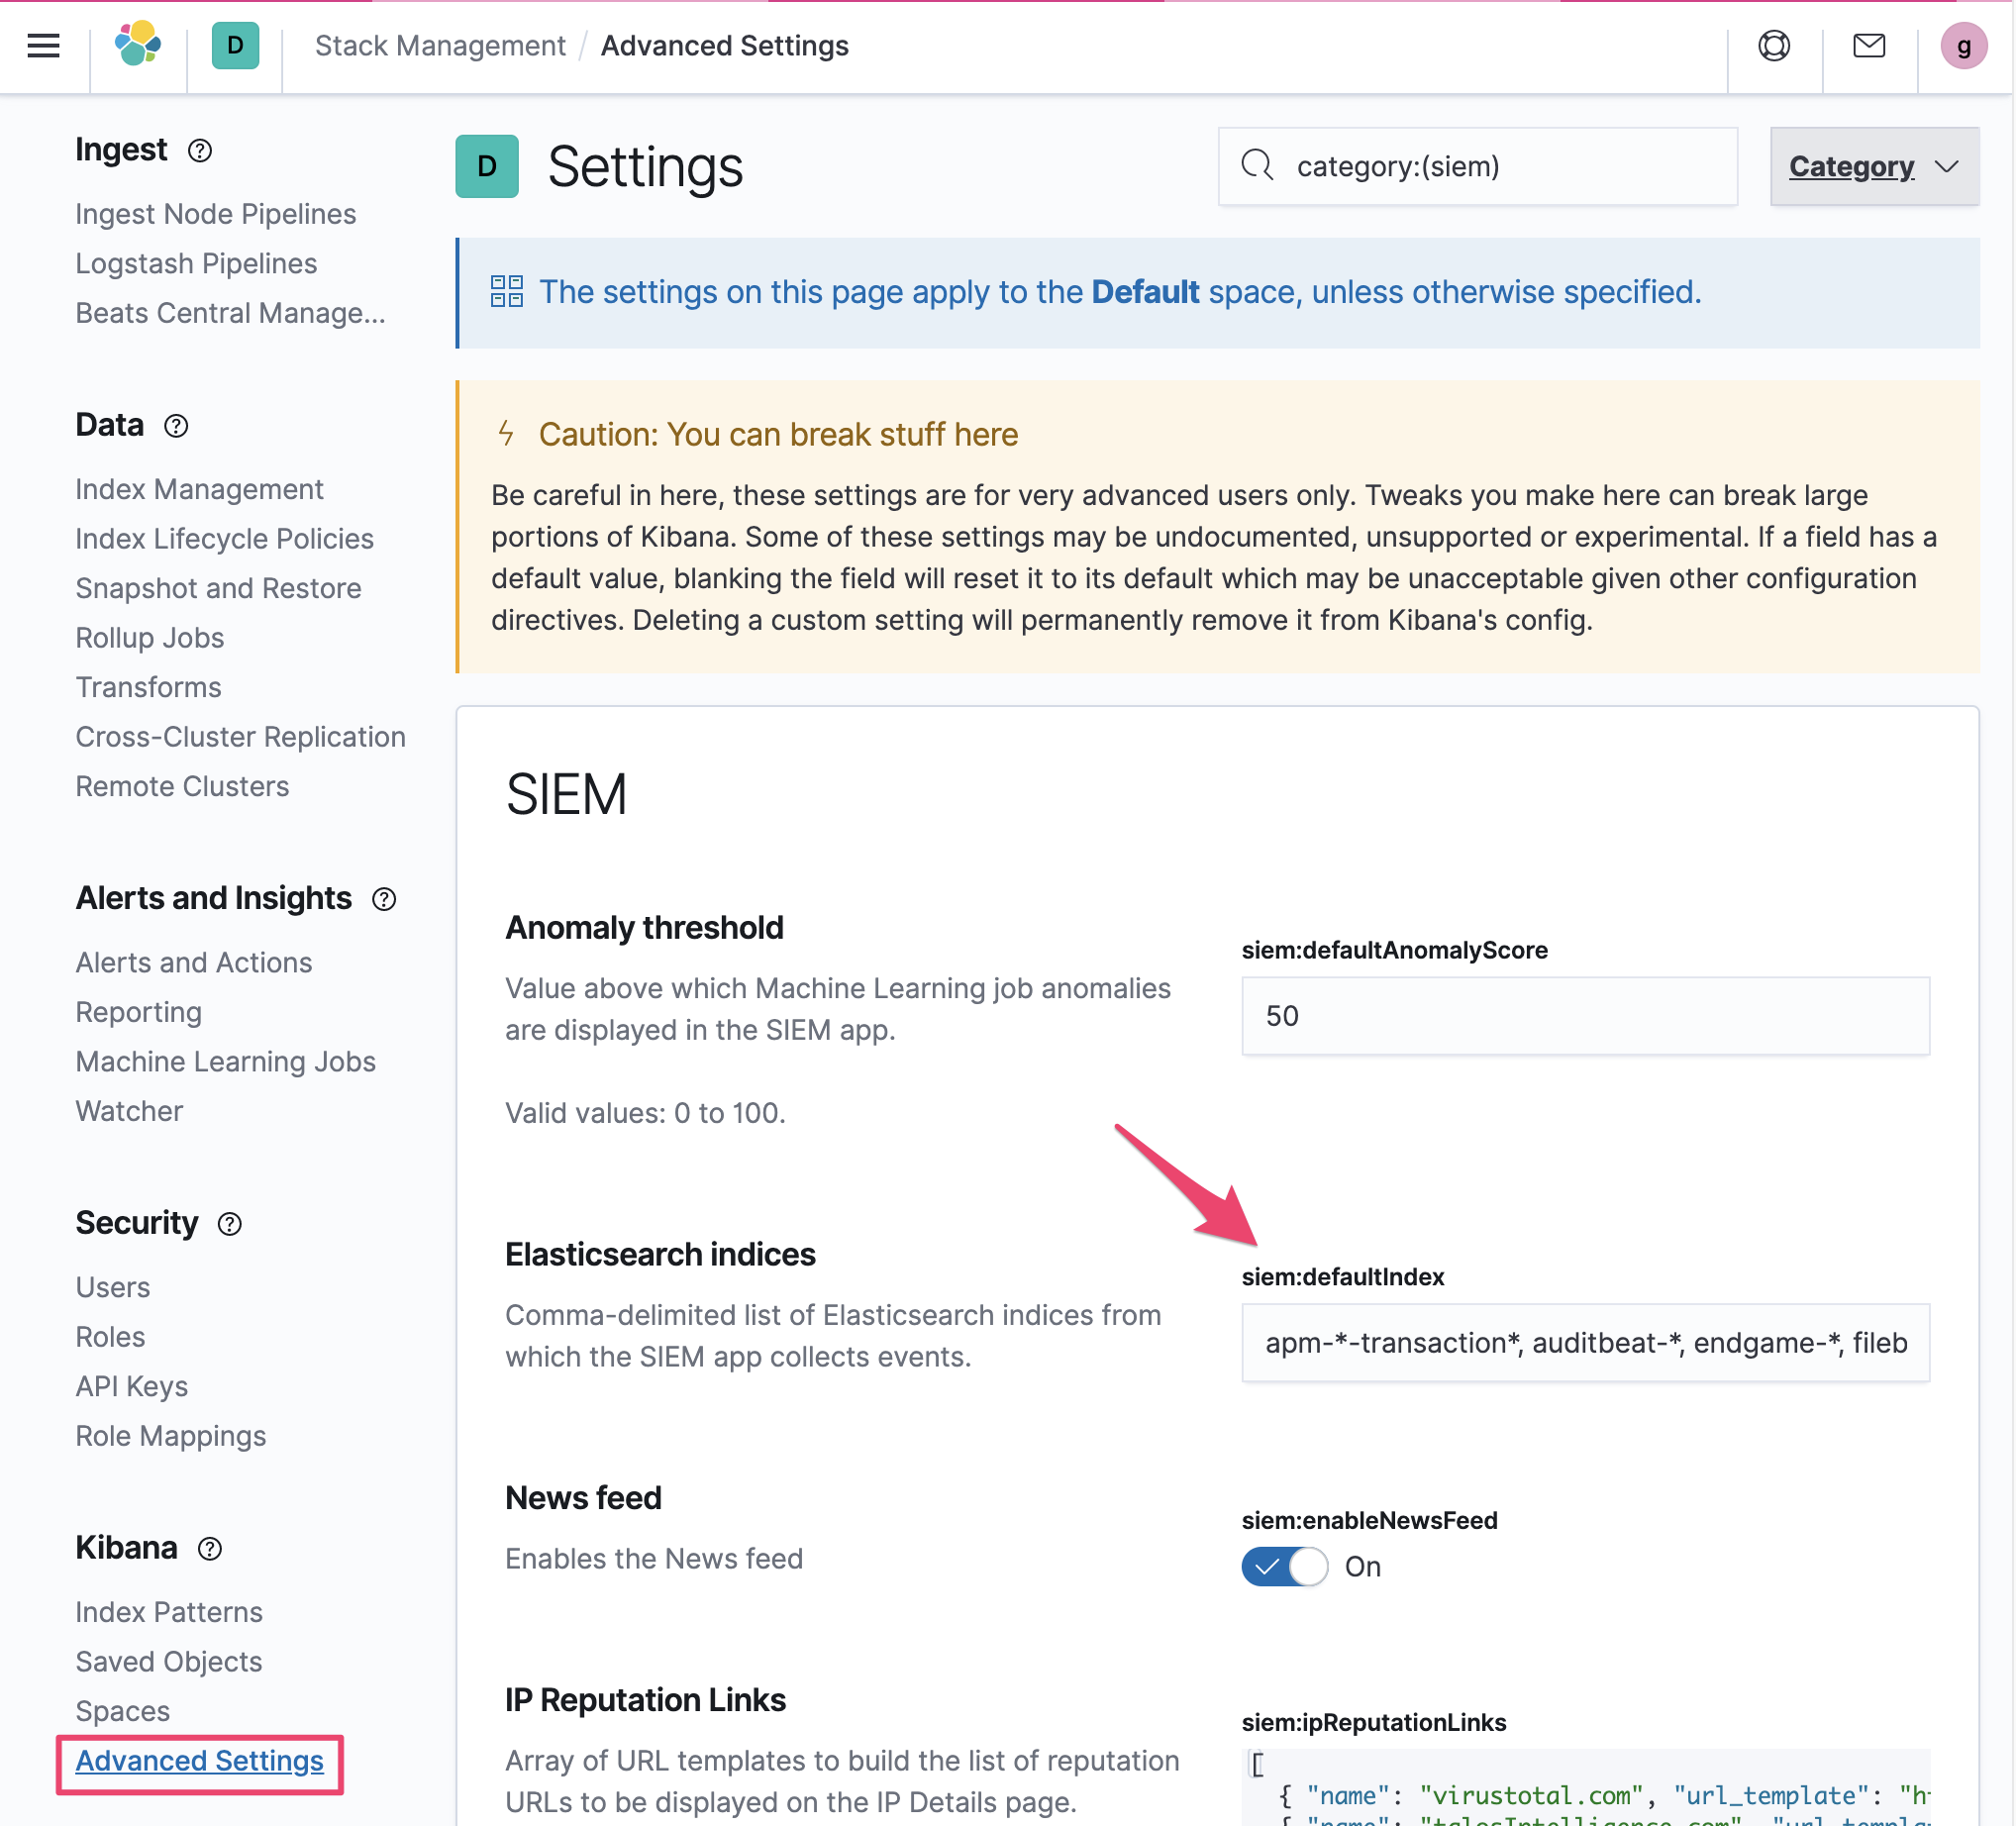
The first thing to check is that the data index you're sending your Graylog data to has been added to the siem:defaultIndex configuration setting under Management -> Kibana -> Advanced Settings -> SIEM.
We've provided a few default indices that correspond to the common beats used with SIEM, but in order to leverage custom data you'll want to add your data indices to this setting. As shown, you can use globs to match multiple ES indices.
Once that's configured, the next thing to verify is that your data is in the correct format. The majority of the SIEM App and its visualizations rely on data following the Elastic Common Schema (ECS), as this enables us to reference a common field-set that can span many different data sources.
To ensure your data is being mapped to ECS, there's this wonderful blog post that outlines how to set things up either using beats, or for your case, how to add an ingest pipeline to convert fields to ECS using the ecs-mapper tool.
Lastly, if you're curious why data isn't showing up in a particular visualization, you can use the inspect feature to see what index patterns are being queried, and more importantly, what fields are required.
Hopefully that provides some context for how to get your data showing up within the SIEM App, and if for some reason this doesn't resolve the issue you're seeing, feel free to respond back with details and we can dig a bit deeper!
So by default, if the index does not exist it'll be created automatically when putting data. This will create an index with a dynamic mapping though (so long as you don't have any index templates configured), so you'll want to watch out for that. You can read more about how indices are created automatically here.
Depending on how you're ingesting your GELF output from Graylog, you might just be able to to use an ingest pipeline to convert your fields to ECS with the correct mapping. The blog post linked above goes into detail on getting that set up.
Apache, Apache Lucene, Apache Hadoop, Hadoop, HDFS and the yellow elephant
logo are trademarks of the
Apache Software Foundation
in the United States and/or other countries.