Grok and parsing of logstash data

Good morning
I am integrating data from an application called telegraf into logstash
here is my telegraf conf file

# Global Agent Configuration
[agent]
  hostname = ""
  flush_interval = "15s"
  interval = "1500s"
  omit_hostname = false

# gRPC Dial-Out Telemetry Listener
[[inputs.cisco_telemetry_mdt]]
  transport = "grpc"
  service_address = ":57500"


# Output Plugin
[[outputs.socket_writer]]
  address = "tcp://x.x.x.x:5044"
  data_format = "json"
  json_timestamp_units = "1ns"


[[outputs.file]]
  files = ["/tmp/telegraf-grpc.log"]

and this is the output in /tmp/telegraf-grpc.conf

Cisco-IOS-XE-process-cpu-oper:cpu-usage/cpu-utilization,host=ibcinmnrffd1v,path=Cisco-IOS-XE-process-cpu-oper:cpu-usage/cpu-utilization,source=hclab043-gnmic,subscription=101 five_seconds=1i 1750674175479000000
Cisco-IOS-XE-process-cpu-oper:cpu-usage/cpu-utilization,host=ibcinmnrffd1v,path=Cisco-IOS-XE-process-cpu-oper:cpu-usage/cpu-utilization,source=hclab043-gnmic,subscription=101 five_seconds=0i 1750674180475000000

and this is logstash conf file

# Beats -> Logstash -> Elasticsearch pipeline.

input {
    tcp {
            port => 5044
            codec => json {}
  }
}


filter {
  grok {
    match => {
      "message" => [
        "%{DATA:metric},host=%{HOSTNAME},path=%{DATA:path},source=%{DATA:source},subscription=%{INT:subscription} five_seconds=%{INT:five_seconds}i %{NUMBER:timestamp}"
      ]
    }
    remove_field => ["host", "path", "tags.host", "_id",   "timestamp", "metric", "message"]
  }

  mutate {
    convert => { "five_seconds" => "integer" }
    add_field => { "cpu_usage_5s_percent" => "%{five_seconds}%%" }
  }
}


output {
  elasticsearch {
    hosts => ["https://localhost:9200"]
    index => "streaming-new"
    user => "elastic"
    password => "xxxxxxxxxx"
    #ssl_enabled => true
    ssl_certificate_verification => false
  }
  file {
        path => "/tmp/streaming-output"
  }

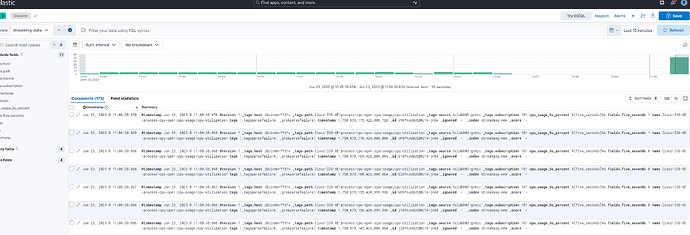
and then this is the output in kibana

as i caanot upload it into the forum


i want to remove timestamp, tags , host, _id, index, score , subscription , using grok but it does not seem to be working

It's not working because your grok pattern is not matching. Event decoration (i.e. add_field, remove_field, add_tag , remove_tag) only happens if a filter "succeeds". If the grok pattern matches then the remove_field will happen (it is not quite that simple if there are multiple patterns, but you only use one).

You are also getting a _tagsparsefailure tag. Assuming event_api.tags.illegal is set to rename in logstash.yml that's telling you that the JSON contains a hash called [tags], and [tags] has to be an array of strings, not a hash. If given a hash called [tags] the event creation methods will rename it to [_tags]. So, you can remove those fields using

remove_field => [ "_tags" ]

to remove the whole hash or

remove_field => [ "[_tags][host]" ]

to remove individual members.

Note that you are also removing fields that you just created in the grok, so you can just not create them, and you can let grok do the integer conversion. Also, _id is not an optional field, elasticsearch will create it if it is not supplied. That simplifies things to

grok {
    match => {
        "message" => [
            "%{DATA},host=%{HOSTNAME},path=%{DATA},source=%{DATA:source},subscription=%{INT:subscription} five_seconds=%{INT:five_seconds:int}i %{NUMBER}"
          ]
    }
    remove_field => ["host", "path", "_tags", "message"]
    add_field => { "cpu_usage_5s_percent" => "%{five_seconds}%%" }
}

Hi
Thanks for your reply
I am still having issues with the grok filter
This my new code

input {
    tcp {
            port => 5044
            codec => json {}
  }
}


filter {
  grok {
    match => {
      "message" => "^%{DATA:measurement},host=%{HOSTNAME:_tags.host},name=%{DATA:_tags.name},path=%{DATA:_tags.path},source=%{DATA:_tags.source},subscription=%{INT:_tags.subscription} in_octets=%{INT:in_octets}i %{INT:timestamp}"
    }
  }

  mutate {
    remove_field => [
      "_tags.host",
      "_tags.name",
      "_tags.path",
      "_tags.source",
      "_tags.subscription",
      "[_tags][host]",
      "[_tags][path]",
      "[_tags][subscription]",
      "[_tags][name]",
      "[_tags][source]",
      "[_tags.host.keyword]",
      "[_tags.name.keyword]",
      "[_tags.path.keyword]",
      "[_tags.source.keyword]",
      "[_tags.subscription.keyword]",
      "tags",
      "tags.keyword"
    ]
  }
}

And also the view and contents in kibana

![image|690x307](upload://2zf6zftOGqB3VFQRZMUsaItB3db.png)

The output details in kibana

{
  "@timestamp": [
    "2025-06-26T13:34:43.291Z"
  ],
  "@version": [
    "1"
  ],
  "@version.keyword": [
    "1"
  ],
  "_tags.host": [
    "ibcinmnrffd1v"
  ],
  "_tags.host.keyword": [
    "ibcinmnrffd1v"
  ],
  "_tags.name": [
    "GigabitEthernet0/0"
  ],
  "_tags.name.keyword": [
    "GigabitEthernet0/0"
  ],
  "_tags.path": [
    "openconfig-interfaces:interfaces/interface/state/counters"
  ],
  "_tags.path.keyword": [
    "openconfig-interfaces:interfaces/interface/state/counters"
  ],
  "_tags.source": [
    "hclab043-gnmic"
  ],
  "_tags.source.keyword": [
    "hclab043-gnmic"
  ],
  "_tags.subscription": [
    "106"
  ],
  "_tags.subscription.keyword": [
    "106"
  ],
  "fields.in_octets": [
    1831309585
  ],
  "name": [
    "openconfig-interfaces:interfaces/interface/state/counters"
  ],
  "name.keyword": [
    "openconfig-interfaces:interfaces/interface/state/counters"
  ],
  "tags": [
    "_tagsparsefailure",
    "_grokparsefailure",
    "_dateparsefailure"
  ],
  "tags.keyword": [
    "_tagsparsefailure",
    "_grokparsefailure",
    "_dateparsefailure"
  ],
  "timestamp": [
    1750945216505000000
  ],
  "_id": "DV9yrJcBUIBRc1H-okvN",
  "_index": "streaming-new",
  "_score": null
}


Thanks

The fields for which the names end in .keyword are not present in logstash, so remove_field cannot delete them. They are created by elasticsearch when the document is indexed. You will need to change the document mapping in elasticsearch. See here for the basics of why they were introduced, here for what the mapping syntax looks like.

Kibana and elasticsearch do not present field names in the same way as logstash. In logstash "_tags.path" has to be referred to as [_tags][path]

logstash can distinguish between fields with . in the name and nested fields, so { "a.b": 0 } would be [a.b], and { "a": { "b": 0 } } would be [a][b]. Names do not work that way in elasticsearch. To understand the structure of the data (and so which name logstash will use) have kibana present the document as JSON.

Hi,

I am still having issues with grok filter

This is my configuration

Sample Logstash configuration for creating a simple

Beats -> Logstash -> Elasticsearch pipeline.

input {

tcp {

port => 5085

codec => json {}

}

}

filter {

mutate {

remove_field => ["[_tags][host]"]

}

}

output {

elasticsearch {

hosts => ["https://localhost:9200"]

index => "telegraf-new"

user => "elastic"

password => ""

#ssl_enabled => true

ssl_certificate_verification => false

}

file {

path => "/tmp/streaming-output"

}

}

And this is the output in kibana

Can you copy the message or event.original field? Those where is _grokparsefailure. Also 1-2 which are without an error.

Hi

This is the output in a text file

{

"@timestamp": [

"2025-07-10T10:18:24.488Z"

],

"@version": [

"1"

],

"@version.keyword": [

"1"

],

"_tags.host": [

"ibcinmnrffd1v"

],

"_tags.host.keyword": [

"ibcinmnrffd1v"

],

"_tags.name": [

"GigabitEthernet0/0"

],

"_tags.name.keyword": [

"GigabitEthernet0/0"

],

"_tags.path": [

"openconfig-interfaces:interfaces/interface/state/counters"

],

"_tags.path.keyword": [

"openconfig-interfaces:interfaces/interface/state/counters"

],

"_tags.source": [

"hclab043-gnmic"

],

"_tags.source.keyword": [

"hclab043-gnmic"

],

"_tags.subscription": [

"140"

],

"_tags.subscription.keyword": [

"140"

],

"fields.in_octets": [

2617367341

],

"name": [

"openconfig-interfaces:interfaces/interface/state/counters"

],

"name.keyword": [

"openconfig-interfaces:interfaces/interface/state/counters"

],

"tags": [

"_tagsparsefailure"

],

"tags.keyword": [

"_tagsparsefailure"

],

"timestamp": [

1752143021161000000

],

"_id": "Ds_X85cBfkn1XF9i7xLv",

"_index": "telegraf-new",

"_score": null

}

Thanks

Daley

We need something like this. You are removing "message", so it's not visible what came to LS as raw data.

Hi,

Thanks for your quick response

{"message":"<189>227601: *Jul 10 13:12:52.119 UTC: %SSH-5-SSH2_SESSION: SSH2 Session request from 10.200.250.20 (tty = 0) using crypto cipher 'aes128-ctr', hmac 'hmac-sha2-256-etm@openssh.com' Succeeded","@version":"1","tags":["_jsonparsefailure","_grokparsefailure"],"host":{"ip":"10.200.226.59"},"@timestamp":"2025-07-10T13:07:18.318901969Z","event":{"original":"<189>227601: *Jul 10 13:12:52.119 UTC: %SSH-5-SSH2_SESSION: SSH2 Session request from 10.200.250.20 (tty = 0) using crypto cipher 'aes128-ctr', hmac 'hmac-sha2-256-etm@openssh.com' Succeeded"},"type":"syslog"}

{"message":"<189>227603: *Jul 10 13:12:52.167 UTC: %SSH-5-SSH2_USERAUTH: User 't_dnac' authentication for SSH2 Session from 10.200.250.20 (tty = 0) using crypto cipher 'aes128-ctr', hmac 'hmac-sha2-256-etm@openssh.com' Succeeded","@version":"1","tags":["_jsonparsefailure","_grokparsefailure"],"host":{"ip":"10.200.226.59"},"@timestamp":"2025-07-10T13:07:18.319350624Z","event":{"original":"<189>227603: *Jul 10 13:12:52.167 UTC: %SSH-5-SSH2_USERAUTH: User 't_dnac' authentication for SSH2 Session from 10.200.250.20 (tty = 0) using crypto cipher 'aes128-ctr', hmac 'hmac-sha2-256-etm@openssh.com' Succeeded"},"type":"syslog"}

{"message":"<189>227602: *Jul 10 13:12:52.167 UTC: %SEC_LOGIN-5-LOGIN_SUCCESS: Login Success [user: t_dnac] [Source: 10.200.250.20] [localport: 22] at 13:12:52 UTC Thu Jul 10 2025","@version":"1","tags":["_jsonparsefailure","_grokparsefailure"],"host":{"ip":"10.200.226.59"},"@timestamp":"2025-07-10T13:07:18.318984443Z","event":{"original":"<189>227602: *Jul 10 13:12:52.167 UTC: %SEC_LOGIN-5-LOGIN_SUCCESS: Login Success [user: t_dnac] [Source: 10.200.250.20] [localport: 22] at 13:12:52 UTC Thu Jul 10 2025"},"type":"syslog"}

{"message":"<189>227601: *Jul 10 13:12:52.119 UTC: %SSH-5-SSH2_SESSION: SSH2 Session request from 10.200.250.20 (tty = 0) using crypto cipher 'aes128-ctr', hmac 'hmac-sha2-256-etm@openssh.com' Succeeded","@version":"1","tags":["_jsonparsefailure","_grokparsefailure"],"host":{"ip":"10.200.226.59"},"@timestamp":"2025-07-10T13:07:18.318901969Z","event":{"original":"<189>227601: *Jul 10 13:12:52.119 UTC: %SSH-5-SSH2_SESSION: SSH2 Session request from 10.200.250.20 (tty = 0) using crypto cipher 'aes128-ctr', hmac 'hmac-sha2-256-etm@openssh.com' Succeeded"},"type":"syslog"}

{"message":"<189>227603: *Jul 10 13:12:52.167 UTC: %SSH-5-SSH2_USERAUTH: User 't_dnac' authentication for SSH2 Session from 10.200.250.20 (tty = 0) using crypto cipher 'aes128-ctr', hmac 'hmac-sha2-256-etm@openssh.com' Succeeded","@version":"1","tags":["_jsonparsefailure","_grokparsefailure"],"host":{"ip":"10.200.226.59"},"@timestamp":"2025-07-10T13:07:18.319350624Z","event":{"original":"<189>227603: *Jul 10 13:12:52.167 UTC: %SSH-5-SSH2_USERAUTH: User 't_dnac' authentication for SSH2 Session from 10.200.250.20 (tty = 0) using crypto cipher 'aes128-ctr', hmac 'hmac-sha2-256-etm@openssh.com' Succeeded"},"type":"syslog"}

{"@timestamp":"2025-07-10T13:07:39.711967069Z","tags":["_tagsparsefailure"],"_tags":[{"name":"GigabitEthernet0/0","source":"hclab043-gnmic","path":"openconfig-interfaces:interfaces/interface/state/counters","subscription":"140","host":"ibcinmnrffd1v"}],"@version":"1","timestamp":1752153191207000000,"fields":{"in_octets":2623532390},"name":"openconfig-interfaces:interfaces/interface/state/counters"}

{"@timestamp":"2025-07-10T13:08:09.713833274Z","tags":["_tagsparsefailure"],"_tags":[{"name":"GigabitEthernet0/0","source":"hclab043-gnmic","path":"openconfig-interfaces:interfaces/interface/state/counters","subscription":"140","host":"ibcinmnrffd1v"}],"@version":"1","timestamp":1752153221206000000,"fields":{"in_octets":2623594978},"name":"openconfig-interfaces:interfaces/interface/state/counters"}

#{"@timestamp":"2025-07-10T13:08:39.714581855Z","tags":["_tagsparsefailure"],"_tags":[{"name":"GigabitEthernet0/0","source":"hclab043-gnmic","path":"openconfig-interfaces:interfaces/interface/state/counters","subscription":"140","host":"ibcinmnrffd1v"}],"@version":"1","timestamp":1752153251207000000,"fields":{"in_octets":2623619950},"name":"openconfig-interfaces:interfaces/interface/state/counters"}

Thanks

Daley
Hi ,

I have removed the _tags field but still want change field.in_octets to in_octets and also remove some field

Such as tags _id, timestamp, index and score

This is an output of the file

{

"@timestamp": [

"2025-07-11T16:31:13.504Z"

],

"@version": [

"1"

],

"@version.keyword": [

"1"

],

"fields.in_octets": [

2682852411

],

"name": [

"openconfig-interfaces:interfaces/interface/state/counters"

],

"name.keyword": [

"openconfig-interfaces:interfaces/interface/state/counters"

],

"tags": [

"_tagsparsefailure",

"_grokparsefailure"

],

"tags.keyword": [

"_tagsparsefailure",

"_grokparsefailure"

],

"timestamp": [

1752251801614000000

],

"_id": "wvBT-pcBuPFZnCR-n1gx",

"_index": "telegraf-new",

"_score": null

}

That will get parsed as [fields][in_octets], which you can rename using

mutate { rename => { "[fields][in_octets]" => "[in_octets]" } }

_id, _index and _score are not optional. elasticsearch will generate them.

To remove timestamp just use

mutate { remove_field => [ "timestamp" ] }