I have some documents like those:
{
timestamp: t,
player: playerA,
team: teamA,
totalPoints: 10
},
{
timestamp: t,
player: playerB,
team: teamA,
totalPoints: 5
},
{
timestamp: t,
player: playerc,
team: teamA,
totalPoints: 10
},

{
timestamp: t+1,
player: playerA,
team: teamA,
totalPoints: 20
},
{
timestamp: t+1,
player: playerB,
team: teamA,
totalPoints: 10
},
{
timestamp: t,
player: playerc,
team: teamA,
totalPoints: 10
},
"totalPoints" is an integer with the total points earned by a player until this moment t.
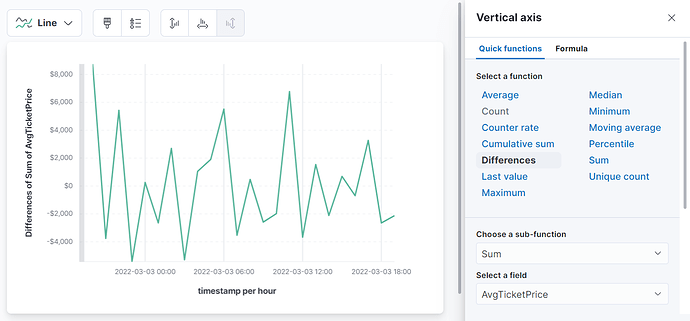
Is there a way to plot in bars the points incremented in time by teams?
