I'm looking into why some of the nodes we have in our cluster have a high CPU load from time to time. I run a hot_threads output but I really can't make heads or tails from it. Could someone point me in the right direction.
I'm looking into why some of the nodes we have in our cluster have a high
CPU load from time to time. I run a hot_threads output but I really can't
make heads or tails from it. Could someone point me in the right direction.
Cluster size is 9 nodes hosted on AWS using r3.2xlarge instance type (8 Core and 61gb of Memory)
ES version is 1.3.7
Java version is "1.7.0_60"
Looking at the logs for one of the nodes with high CPU load and nothing is jumping out at me. What should I be looking for?
Also, I forgot to mention last time that this only occurs on one or two nodes. All nodes are behind a load balancer and should be getting equivalent traffic. Also always the same nodes that have this issue. I'll nodes are the same and are setup by OpsWorks (Chef).
Can you correlate high CPU with some other activities e.g. high I/O,
index refresh, segment merges?
Are you using marvel (its your best friend to understand whats creating
CPU load)
In our setup we ran in to High CPU pressures due to i/o bottlenecks. We
were on spindles and our indexing volume would push the disk I/O to peak,
resulting in CPU spikes.
Short term fix, we did a firmware upgrade on disks.
Long term fix we are now on SSDs
Hope this helps.
On Tuesday, 3 February 2015 11:18:20 UTC-8, Anthony Scotti wrote:
Hi,
I'm looking into why some of the nodes we have in our cluster have a high
CPU load from time to time. I run a hot_threads output but I really can't
make heads or tails from it. Could someone point me in the right
direction.
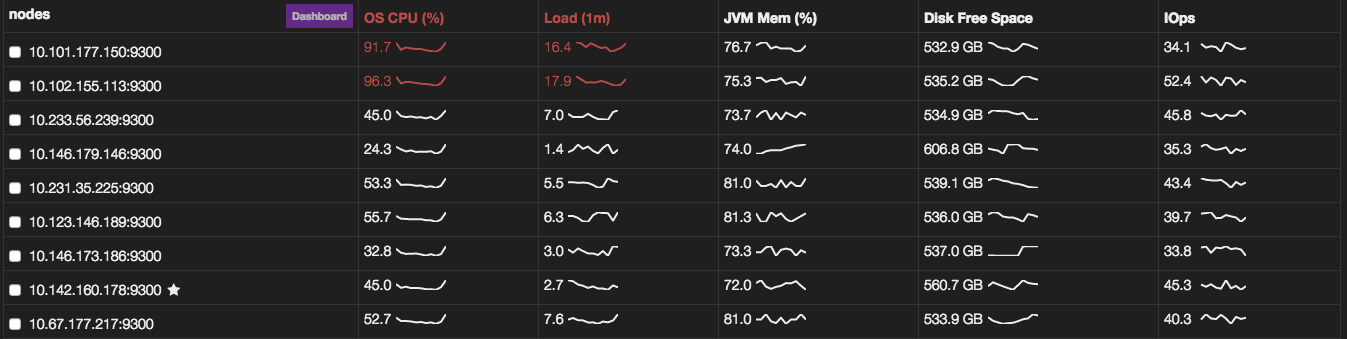
We are using 'General Purpose (SSD)' on all the systems on AWS. All the
IOPs for the nodes in the cluster are about the same but only 1~2 nodes are
having high CPU/Load.
I do have Marvel installed, where should I be looking? Looking at all the
details for the node nothing is really popping out for me but I could just
be over looking it.
Let me know if any more info would be helpful. I am kind of at a lost of
where to look.
Here is an image of the 2 nodes that are having the issue from the
dashboard,
On Wednesday, February 4, 2015 at 2:49:06 AM UTC-5, Sarang Zargar wrote:
More details would be definitely helpful.
Are you on Spindles or SSDs?
Can you correlate high CPU with some other activities e.g. high I/O,
index refresh, segment merges?
Are you using marvel (its your best friend to understand whats creating
CPU load)
In our setup we ran in to High CPU pressures due to i/o bottlenecks. We
were on spindles and our indexing volume would push the disk I/O to peak,
resulting in CPU spikes.
Short term fix, we did a firmware upgrade on disks.
Long term fix we are now on SSDs
Hope this helps.
On Tuesday, 3 February 2015 11:18:20 UTC-8, Anthony Scotti wrote:
Hi,
I'm looking into why some of the nodes we have in our cluster have a high
CPU load from time to time. I run a hot_threads output but I really can't
make heads or tails from it. Could someone point me in the right
direction.
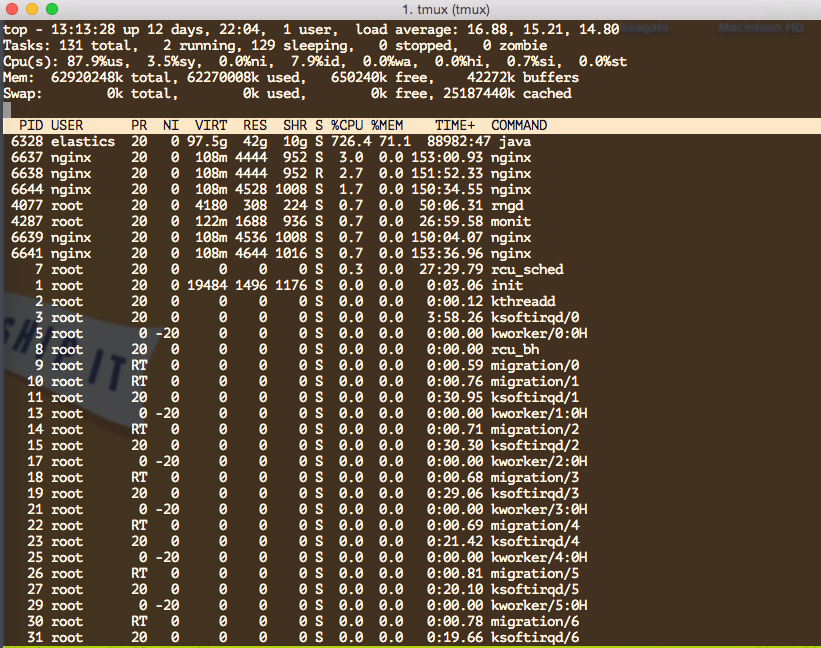
Can you execute "top" on these instances and see whats pushing the CPU. Is
it a rogue process or something else?
Marvel will not be really helpful here, you need to look in to the
instance.
Please share the findings, this is really interesting.
On Wednesday, 4 February 2015 05:58:53 UTC-8, Anthony Scotti wrote:
Hi Sarang,
We are using 'General Purpose (SSD)' on all the systems on AWS. All the
IOPs for the nodes in the cluster are about the same but only 1~2 nodes
are having high CPU/Load.
I do have Marvel installed, where should I be looking? Looking at all the
details for the node nothing is really popping out for me but I could just
be over looking it.
Let me know if any more info would be helpful. I am kind of at a lost of
where to look.
Here is an image of the 2 nodes that are having the issue from the
dashboard,
On Wednesday, February 4, 2015 at 2:49:06 AM UTC-5, Sarang Zargar wrote:
More details would be definitely helpful.
Are you on Spindles or SSDs?
Can you correlate high CPU with some other activities e.g. high I/O,
index refresh, segment merges?
Are you using marvel (its your best friend to understand whats creating
CPU load)
In our setup we ran in to High CPU pressures due to i/o bottlenecks. We
were on spindles and our indexing volume would push the disk I/O to peak,
resulting in CPU spikes.
Short term fix, we did a firmware upgrade on disks.
Long term fix we are now on SSDs
Hope this helps.
On Tuesday, 3 February 2015 11:18:20 UTC-8, Anthony Scotti wrote:
Hi,
I'm looking into why some of the nodes we have in our cluster have a
high
CPU load from time to time. I run a hot_threads output but I really
can't
make heads or tails from it. Could someone point me in the right
direction.
On Wednesday, February 4, 2015 at 9:38:52 PM UTC-5, Sarang Zargar wrote:
Can you execute "top" on these instances and see whats pushing the CPU. Is
it a rogue process or something else?
Marvel will not be really helpful here, you need to look in to the
instance.
Please share the findings, this is really interesting.
On Wednesday, 4 February 2015 05:58:53 UTC-8, Anthony Scotti wrote:
Hi Sarang,
We are using 'General Purpose (SSD)' on all the systems on AWS. All the
IOPs for the nodes in the cluster are about the same but only 1~2 nodes
are having high CPU/Load.
I do have Marvel installed, where should I be looking? Looking at all the
details for the node nothing is really popping out for me but I could just
be over looking it.
Let me know if any more info would be helpful. I am kind of at a lost of
where to look.
Here is an image of the 2 nodes that are having the issue from the
dashboard,
On Wednesday, February 4, 2015 at 2:49:06 AM UTC-5, Sarang Zargar wrote:
More details would be definitely helpful.
Are you on Spindles or SSDs?
Can you correlate high CPU with some other activities e.g. high I/O,
index refresh, segment merges?
Are you using marvel (its your best friend to understand whats
creating CPU load)
In our setup we ran in to High CPU pressures due to i/o bottlenecks. We
were on spindles and our indexing volume would push the disk I/O to peak,
resulting in CPU spikes.
Short term fix, we did a firmware upgrade on disks.
Long term fix we are now on SSDs
Hope this helps.
On Tuesday, 3 February 2015 11:18:20 UTC-8, Anthony Scotti wrote:
Hi,
I'm looking into why some of the nodes we have in our cluster have a
high
CPU load from time to time. I run a hot_threads output but I really
can't
make heads or tails from it. Could someone point me in the right
direction.
Apache, Apache Lucene, Apache Hadoop, Hadoop, HDFS and the yellow elephant
logo are trademarks of the
Apache Software Foundation
in the United States and/or other countries.