How can I better organize the data in my project?

Hello everyone!

Before I start with my question, I'll describe my project a bit. We have companies that can have an unlimited number of databases with various information. The mappings in all databases are roughly the same, but there are differences. Dynamic mapping is not suitable for us.

We have 6 nodes: 3 master and 3 data nodes. Currently, we have about 600 indexes and 3.1 billion documents. Searching across all fields is extremely slow (20s. per request). As for getting suggestions while typing a search query, that's out of the question.

The sizes of the indexes can vary. The largest one is 60GB, which we divide into 10GB shards each.

1 database = 1 index

Is there a more humane way to organize such a structure?
With each day, the number of indexes grows and these data are not historical. We can't predict the mappings for the future...

Over time, we realized that splitting into indexes works well for hot and cold data architecture. But in our case, we need all the data.

Welcome!

What is the output of:

GET /
GET /_cat/nodes?v
GET /_cat/health?v

Thanks for your answer

GET /

{
  "name" : "es0-master",
  "cluster_name" : "cerebro",
  "cluster_uuid" : "a-yjtZd6Txunb5-koqnijw",
  "version" : {
    "number" : "8.9.1",
    "build_flavor" : "default",
    "build_type" : "deb",
    "build_hash" : "a813d015ef1826148d9d389bd1c0d781c6e349f0",
    "build_date" : "2023-08-10T05:02:32.517455352Z",
    "build_snapshot" : false,
    "lucene_version" : "9.7.0",
    "minimum_wire_compatibility_version" : "7.17.0",
    "minimum_index_compatibility_version" : "7.0.0"
  },
  "tagline" : "You Know, for Search"
}

GET /_cat/nodes?v

GET /_cat/health?v

Please don't post images of text as they are hard to read, may not display correctly for everyone, and are not searchable.

Instead, paste the text and format it with </> icon or pairs of triple backticks (```), and check the preview window to make sure it's properly formatted before posting it. This makes it more likely that your question will receive a useful answer.

It would be great if you could update your post to solve this.

Sorry. This is my first post in this forum. I can't edit my post. Button is disabled. Can i create new post with this question?

I see. Let's keep it as is.

How much RAM and HEAP do you have for the data nodes?

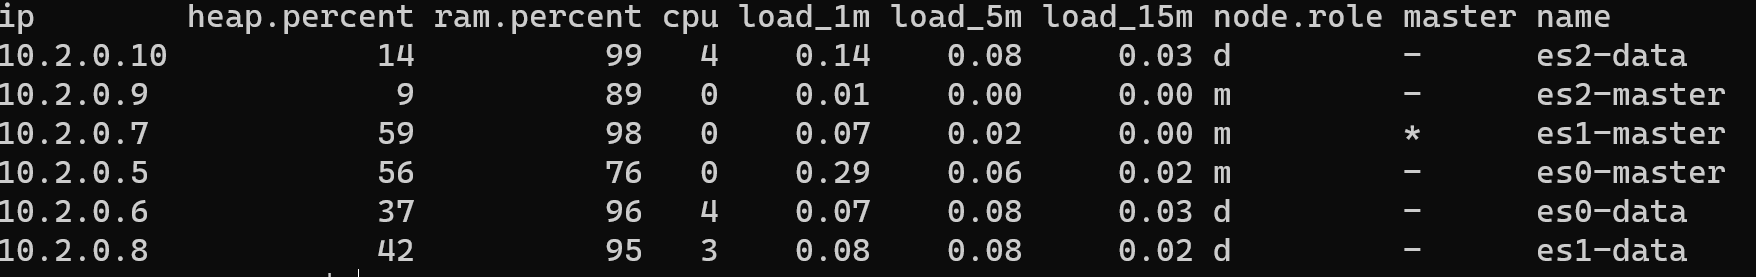
I Have 64Gb RAM memory for 1 data node and see my _nodes/stats

{
   "_nodes":{
      "total":6,
      "successful":6,
      "failed":0
   },
   "cluster_name":"cerebro",
   "nodes":{
      "IqBoCDclSDuvXfwxqBuJTA":{
         "timestamp":1708001842492,
         "name":"es1-master",
         "transport_address":"10.2.0.7:9300",
         "host":"10.2.0.7",
         "ip":"10.2.0.7:9300",
         "roles":[
            "master"
         ],
         "attributes":{
            "xpack.installed":"true"
         },
         "jvm":{
            "timestamp":1708001842492,
            "uptime_in_millis":8748757173,
            "mem":{
               "heap_used_in_bytes":2580518616,
               "heap_used_percent":51,
               "heap_committed_in_bytes":4995416064,
               "heap_max_in_bytes":4995416064,
               "non_heap_used_in_bytes":220068432,
               "non_heap_committed_in_bytes":262012928,
               "pools":{
                  "young":{
                     "used_in_bytes":1736441856,
                     "max_in_bytes":0,
                     "peak_used_in_bytes":2990538752,
                     "peak_max_in_bytes":0
                  },
                  "old":{
                     "used_in_bytes":836784640,
                     "max_in_bytes":4995416064,
                     "peak_used_in_bytes":1493309952,
                     "peak_max_in_bytes":4995416064
                  },
                  "survivor":{
                     "used_in_bytes":7292120,
                     "max_in_bytes":0,
                     "peak_used_in_bytes":78683320,
                     "peak_max_in_bytes":0
                  }
               }
            },
            "threads":{
               "count":75,
               "peak_count":78
            },
            "gc":{
               "collectors":{
                  "young":{
                     "collection_count":18058,
                     "collection_time_in_millis":89229
                  },
                  "G1 Concurrent GC":{
                     "collection_count":18,
                     "collection_time_in_millis":181
                  },
                  "old":{
                     "collection_count":0,
                     "collection_time_in_millis":0
                  }
               }
            },
            "buffer_pools":{
               "mapped":{
                  "count":0,
                  "used_in_bytes":0,
                  "total_capacity_in_bytes":0
               },
               "direct":{
                  "count":29,
                  "used_in_bytes":8423016,
                  "total_capacity_in_bytes":8423014
               },
               "mapped - 'non-volatile memory'":{
                  "count":0,
                  "used_in_bytes":0,
                  "total_capacity_in_bytes":0
               }
            },
            "classes":{
               "current_loaded_count":28889,
               "total_loaded_count":30118,
               "total_unloaded_count":1229
            }
         }
      },
      "zCcNmoeoSsKl1Ia-2FEMDg":{
         "timestamp":1708001873039,
         "name":"es2-data",
         "transport_address":"10.2.0.10:9300",
         "host":"10.2.0.10",
         "ip":"10.2.0.10:9300",
         "roles":[
            "data"
         ],
         "attributes":{
            "xpack.installed":"true"
         },
         "jvm":{
            "timestamp":1708001873040,
            "uptime_in_millis":8480768615,
            "mem":{
               "heap_used_in_bytes":13342589440,
               "heap_used_percent":46,
               "heap_committed_in_bytes":28437381120,
               "heap_max_in_bytes":28437381120,
               "non_heap_used_in_bytes":215098216,
               "non_heap_committed_in_bytes":264044544,
               "pools":{
                  "young":{
                     "used_in_bytes":11207180288,
                     "max_in_bytes":0,
                     "peak_used_in_bytes":17045651456,
                     "peak_max_in_bytes":0
                  },
                  "old":{
                     "used_in_bytes":2118631936,
                     "max_in_bytes":28437381120,
                     "peak_used_in_bytes":8956696064,
                     "peak_max_in_bytes":28437381120
                  },
                  "survivor":{
                     "used_in_bytes":16777216,
                     "max_in_bytes":0,
                     "peak_used_in_bytes":1107296256,
                     "peak_max_in_bytes":0
                  }
               }
            },
            "threads":{
               "count":131,
               "peak_count":138
            },
            "gc":{
               "collectors":{
                  "young":{
                     "collection_count":127757,
                     "collection_time_in_millis":8681424
                  },
                  "G1 Concurrent GC":{
                     "collection_count":222,
                     "collection_time_in_millis":960
                  },
                  "old":{
                     "collection_count":0,
                     "collection_time_in_millis":0
                  }
               }
            },
            "buffer_pools":{
               "mapped":{
                  "count":6040,
                  "used_in_bytes":789386899075,
                  "total_capacity_in_bytes":789386899075
               },
               "direct":{
                  "count":116,
                  "used_in_bytes":10190592,
                  "total_capacity_in_bytes":10190590
               },
               "mapped - 'non-volatile memory'":{
                  "count":0,
                  "used_in_bytes":0,
                  "total_capacity_in_bytes":0
               }
            },
            "classes":{
               "current_loaded_count":29269,
               "total_loaded_count":30639,
               "total_unloaded_count":1370
            }
         }
      },
      "FNltUbwZQYG35l3jF0GTkA":{
         "timestamp":1708001873098,
         "name":"es2-master",
         "transport_address":"10.2.0.9:9300",
         "host":"10.2.0.9",
         "ip":"10.2.0.9:9300",
         "roles":[
            "master"
         ],
         "attributes":{
            "xpack.installed":"true"
         },
         "jvm":{
            "timestamp":1708001873099,
            "uptime_in_millis":8748746700,
            "mem":{
               "heap_used_in_bytes":1515187504,
               "heap_used_percent":30,
               "heap_committed_in_bytes":4995416064,
               "heap_max_in_bytes":4995416064,
               "non_heap_used_in_bytes":199174656,
               "non_heap_committed_in_bytes":242417664,
               "pools":{
                  "young":{
                     "used_in_bytes":1044381696,
                     "max_in_bytes":0,
                     "peak_used_in_bytes":2990538752,
                     "peak_max_in_bytes":0
                  },
                  "old":{
                     "used_in_bytes":468975104,
                     "max_in_bytes":4995416064,
                     "peak_used_in_bytes":1495283200,
                     "peak_max_in_bytes":4995416064
                  },
                  "survivor":{
                     "used_in_bytes":1830704,
                     "max_in_bytes":0,
                     "peak_used_in_bytes":78680400,
                     "peak_max_in_bytes":0
                  }
               }
            },
            "threads":{
               "count":64,
               "peak_count":66
            },
            "gc":{
               "collectors":{
                  "young":{
                     "collection_count":17291,
                     "collection_time_in_millis":240939
                  },
                  "G1 Concurrent GC":{
                     "collection_count":16,
                     "collection_time_in_millis":336
                  },
                  "old":{
                     "collection_count":0,
                     "collection_time_in_millis":0
                  }
               }
            },
            "buffer_pools":{
               "mapped":{
                  "count":0,
                  "used_in_bytes":0,
                  "total_capacity_in_bytes":0
               },
               "direct":{
                  "count":24,
                  "used_in_bytes":8421583,
                  "total_capacity_in_bytes":8421581
               },
               "mapped - 'non-volatile memory'":{
                  "count":0,
                  "used_in_bytes":0,
                  "total_capacity_in_bytes":0
               }
            },
            "classes":{
               "current_loaded_count":27221,
               "total_loaded_count":28483,
               "total_unloaded_count":1262
            }
         }
      },
      "ZHWkJavdQtynApUsDqv77Q":{
         "timestamp":1708001873024,
         "name":"es0-data",
         "transport_address":"10.2.0.6:9300",
         "host":"10.2.0.6",
         "ip":"10.2.0.6:9300",
         "roles":[
            "data"
         ],
         "attributes":{
            "xpack.installed":"true"
         },
         "jvm":{
            "timestamp":1708001873024,
            "uptime_in_millis":8481192667,
            "mem":{
               "heap_used_in_bytes":1337729752,
               "heap_used_percent":4,
               "heap_committed_in_bytes":33285996544,
               "heap_max_in_bytes":33285996544,
               "non_heap_used_in_bytes":210645240,
               "non_heap_committed_in_bytes":264830976,
               "pools":{
                  "young":{
                     "used_in_bytes":352321536,
                     "max_in_bytes":0,
                     "peak_used_in_bytes":19948109824,
                     "peak_max_in_bytes":0
                  },
                  "old":{
                     "used_in_bytes":947295224,
                     "max_in_bytes":33285996544,
                     "peak_used_in_bytes":3293305344,
                     "peak_max_in_bytes":33285996544
                  },
                  "survivor":{
                     "used_in_bytes":38112992,
                     "max_in_bytes":0,
                     "peak_used_in_bytes":1207959552,
                     "peak_max_in_bytes":0
                  }
               }
            },
            "threads":{
               "count":132,
               "peak_count":143
            },
            "gc":{
               "collectors":{
                  "young":{
                     "collection_count":105904,
                     "collection_time_in_millis":6507920
                  },
                  "G1 Concurrent GC":{
                     "collection_count":112,
                     "collection_time_in_millis":615
                  },
                  "old":{
                     "collection_count":0,
                     "collection_time_in_millis":0
                  }
               }
            },
            "buffer_pools":{
               "mapped":{
                  "count":5461,
                  "used_in_bytes":702075533049,
                  "total_capacity_in_bytes":702075533049
               },
               "direct":{
                  "count":118,
                  "used_in_bytes":10256377,
                  "total_capacity_in_bytes":10256375
               },
               "mapped - 'non-volatile memory'":{
                  "count":0,
                  "used_in_bytes":0,
                  "total_capacity_in_bytes":0
               }
            },
            "classes":{
               "current_loaded_count":29206,
               "total_loaded_count":30594,
               "total_unloaded_count":1388
            }
         }
      },
      "LqB-jcMnQVyGjQ4zWuvJFg":{
         "timestamp":1708001887324,
         "name":"es1-data",
         "transport_address":"10.2.0.8:9300",
         "host":"10.2.0.8",
         "ip":"10.2.0.8:9300",
         "roles":[
            "data"
         ],
         "attributes":{
            "xpack.installed":"true"
         },
         "jvm":{
            "timestamp":1708001887325,
            "uptime_in_millis":8480883517,
            "mem":{
               "heap_used_in_bytes":3800723968,
               "heap_used_percent":11,
               "heap_committed_in_bytes":33285996544,
               "heap_max_in_bytes":33285996544,
               "non_heap_used_in_bytes":245646560,
               "non_heap_committed_in_bytes":270073856,
               "pools":{
                  "young":{
                     "used_in_bytes":150994944,
                     "max_in_bytes":0,
                     "peak_used_in_bytes":19948109824,
                     "peak_max_in_bytes":0
                  },
                  "old":{
                     "used_in_bytes":3599397376,
                     "max_in_bytes":33285996544,
                     "peak_used_in_bytes":3733258752,
                     "peak_max_in_bytes":33285996544
                  },
                  "survivor":{
                     "used_in_bytes":50331648,
                     "max_in_bytes":0,
                     "peak_used_in_bytes":1979711488,
                     "peak_max_in_bytes":0
                  }
               }
            },
            "threads":{
               "count":114,
               "peak_count":120
            },
            "gc":{
               "collectors":{
                  "young":{
                     "collection_count":121793,
                     "collection_time_in_millis":6347729
                  },
                  "G1 Concurrent GC":{
                     "collection_count":18,
                     "collection_time_in_millis":159
                  },
                  "old":{
                     "collection_count":0,
                     "collection_time_in_millis":0
                  }
               }
            },
            "buffer_pools":{
               "mapped":{
                  "count":6223,
                  "used_in_bytes":832504456456,
                  "total_capacity_in_bytes":832504456456
               },
               "direct":{
                  "count":95,
                  "used_in_bytes":9753240,
                  "total_capacity_in_bytes":9753238
               },
               "mapped - 'non-volatile memory'":{
                  "count":0,
                  "used_in_bytes":0,
                  "total_capacity_in_bytes":0
               }
            },
            "classes":{
               "current_loaded_count":29219,
               "total_loaded_count":30553,
               "total_unloaded_count":1334
            }
         }
      },
      "Xwy1vW5rQ1mnL-mPx2pR2w":{
         "timestamp":1708001873068,
         "name":"es0-master",
         "transport_address":"10.2.0.5:9300",
         "host":"10.2.0.5",
         "ip":"10.2.0.5:9300",
         "roles":[
            "master"
         ],
         "attributes":{
            "xpack.installed":"true"
         },
         "jvm":{
            "timestamp":1708001873069,
            "uptime_in_millis":8748876942,
            "mem":{
               "heap_used_in_bytes":3817751224,
               "heap_used_percent":76,
               "heap_committed_in_bytes":4995416064,
               "heap_max_in_bytes":4995416064,
               "non_heap_used_in_bytes":199150144,
               "non_heap_committed_in_bytes":240058368,
               "pools":{
                  "young":{
                     "used_in_bytes":2877292544,
                     "max_in_bytes":0,
                     "peak_used_in_bytes":2990538752,
                     "peak_max_in_bytes":0
                  },
                  "old":{
                     "used_in_bytes":936573944,
                     "max_in_bytes":4995416064,
                     "peak_used_in_bytes":1493402624,
                     "peak_max_in_bytes":4995416064
                  },
                  "survivor":{
                     "used_in_bytes":3884736,
                     "max_in_bytes":0,
                     "peak_used_in_bytes":79691776,
                     "peak_max_in_bytes":0
                  }
               }
            },
            "threads":{
               "count":63,
               "peak_count":65
            },
            "gc":{
               "collectors":{
                  "young":{
                     "collection_count":17296,
                     "collection_time_in_millis":183609
                  },
                  "G1 Concurrent GC":{
                     "collection_count":16,
                     "collection_time_in_millis":211
                  },
                  "old":{
                     "collection_count":0,
                     "collection_time_in_millis":0
                  }
               }
            },
            "buffer_pools":{
               "mapped":{
                  "count":0,
                  "used_in_bytes":0,
                  "total_capacity_in_bytes":0
               },
               "direct":{
                  "count":23,
                  "used_in_bytes":8446071,
                  "total_capacity_in_bytes":8446069
               },
               "mapped - 'non-volatile memory'":{
                  "count":0,
                  "used_in_bytes":0,
                  "total_capacity_in_bytes":0
               }
            },
            "classes":{
               "current_loaded_count":27298,
               "total_loaded_count":28492,
               "total_unloaded_count":1194
            }
         }
      }
   }
}

Searching across all fields is extremely slow (20s. per request).

Could you share a typical search request here and the response?

Unfortunately, I cannot share this information.

Examples of requests can be as follows:

  • Sergio Ramos
  • Sergio Ramos New York
  • Serg*
  • AC569875
  • Serg* Ramos

We can search for information by specifying a specific field. The same applies to the field to which we copy data from other fields using copy_to

This code are creating query for elasticsearch:

with Client() as client:
  if fields is None:
      fields = ['full_source']

  results = client.search(
      index='*',
      size=150,
      query={
          "simple_query_string": {
              "query": query,
              "fields": fields,
              "default_operator": "and"
          }
      },
      highlight={
          "fields": {
              "*": {}
          },
          "require_field_match": False
      },
      track_total_hits=150
  )

  return prepare_results(results)

Some guesses here:

  • Serg*
  • Serg* Ramos

Might be the slowest ones.

This might be super slow:

"fields": {
  "*": {}
},
"require_field_match": False

Specifically when asking to highlight 150 documents (size=150 ).

Could you try to run a query without it? And then run with highlight but with less documents (size=10)?

Doesn't highlight start working after the documents have been found?

In terms of the scale of work that needs to be done, out of 150 results, this is not so much. I could be wrong because I don't know how highlighting works. Before or after the documents were found

Please try this and we could then interpret the results.

This could be slow indeed. Should not take 20s but still.

This topic was automatically closed 28 days after the last reply. New replies are no longer allowed.