Hi. I'm trying to visualize the data below.
What do I do if I want to plot two different factors in the same column on each graph?

Hello @IANIAN,
You might consider adding a bucket aggregation to split rows as shown in the image below:
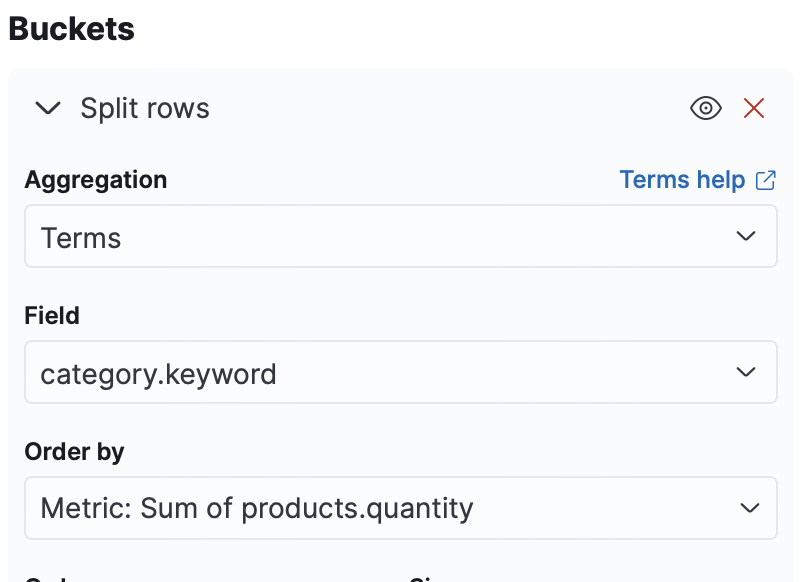
In this case, I am using a terms aggregation. The field could be the one that contains keywords "A" and "B", for example.