Hi, I am stucked in some calculation. I want to calculate following from an index which is having a merged data of employees who left the company and employees who are still working in the company. So, I have 2 types of documents in a single index:
a) Workday Data(Employees working in the company)
b) Attrition Data(Employees who left the company)
Now, I want to calculate Average Headcount and Attrition Rate
- Opening Headcount and Closing Headcount) These are required to calculate Average Headcount, where Opening Headcount is constant and Closing Headcount is the Count of documents of workday type data.
My calculation to calculate Closing Headcount is below-
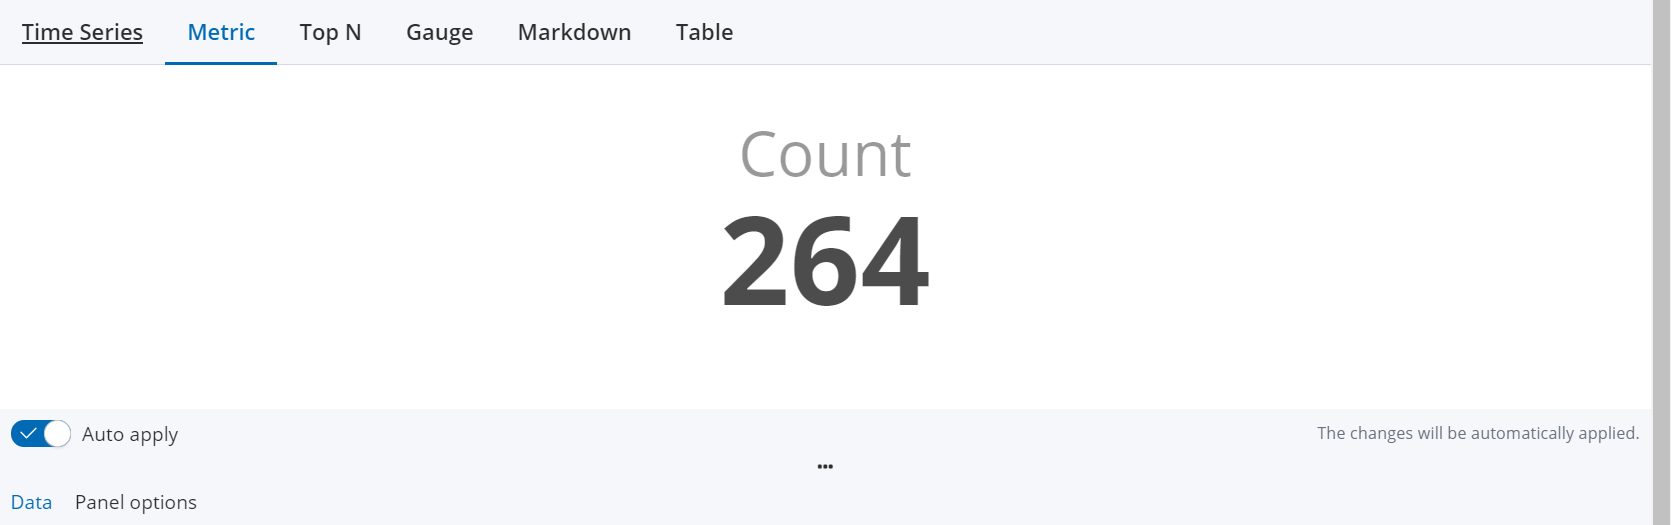

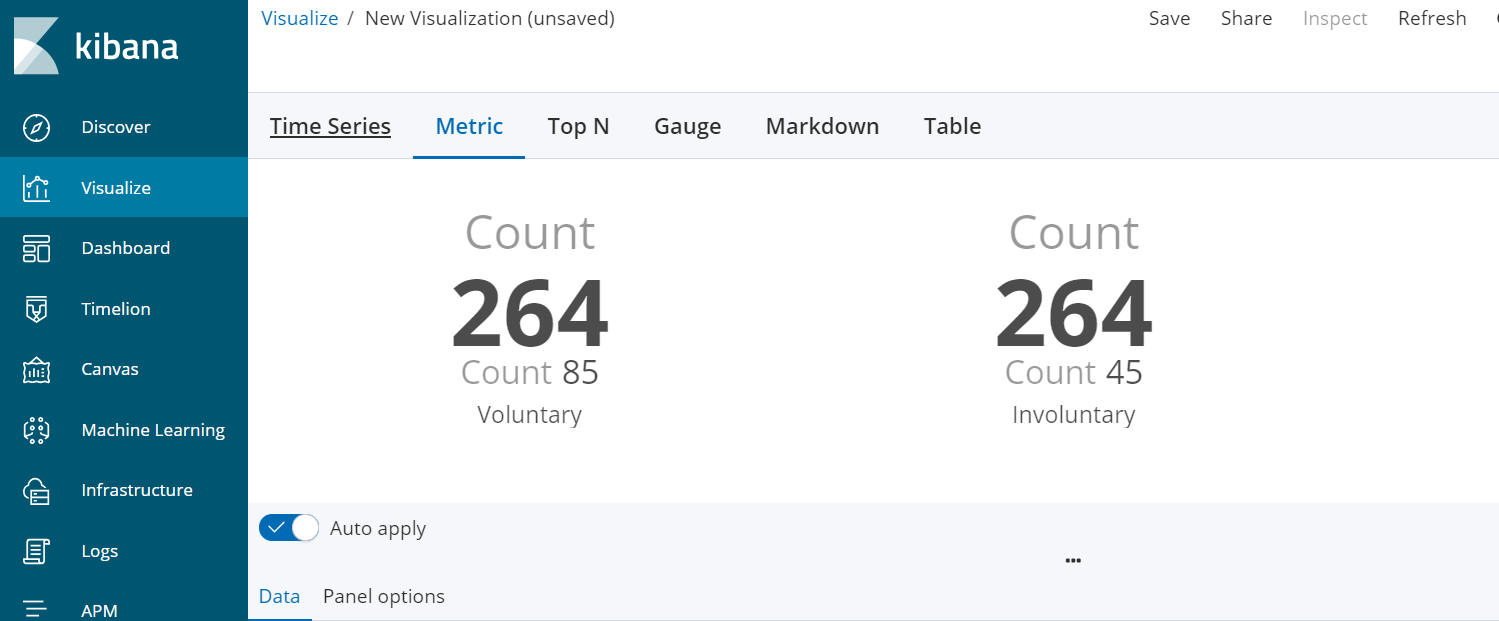
- Attrition Rate) In my index data, there are 2 types of attrition- Voluntary & Involuntary attrition.
I want to calculate the Voluntary Attrition Rate and Involuntary Attrition Rate.
To calculate them, again I need to apply a filter/terms in Group By feature. To do that, I added a new series in Metric Visual Builder as below-

Now, the problem is that I need to show the result of calculation as follows:
(Result of Series 1) / (Result of Series 2)