I'm exploring the APM Alert Failed Transaction Rate Threshold feature but I can't seem to put the rule into an "Active" state.
So for example, I have an APM service that shows Failed Transaction Rate of 48% for about 30 minutes. See these screenshots:


So I created a rule like this:
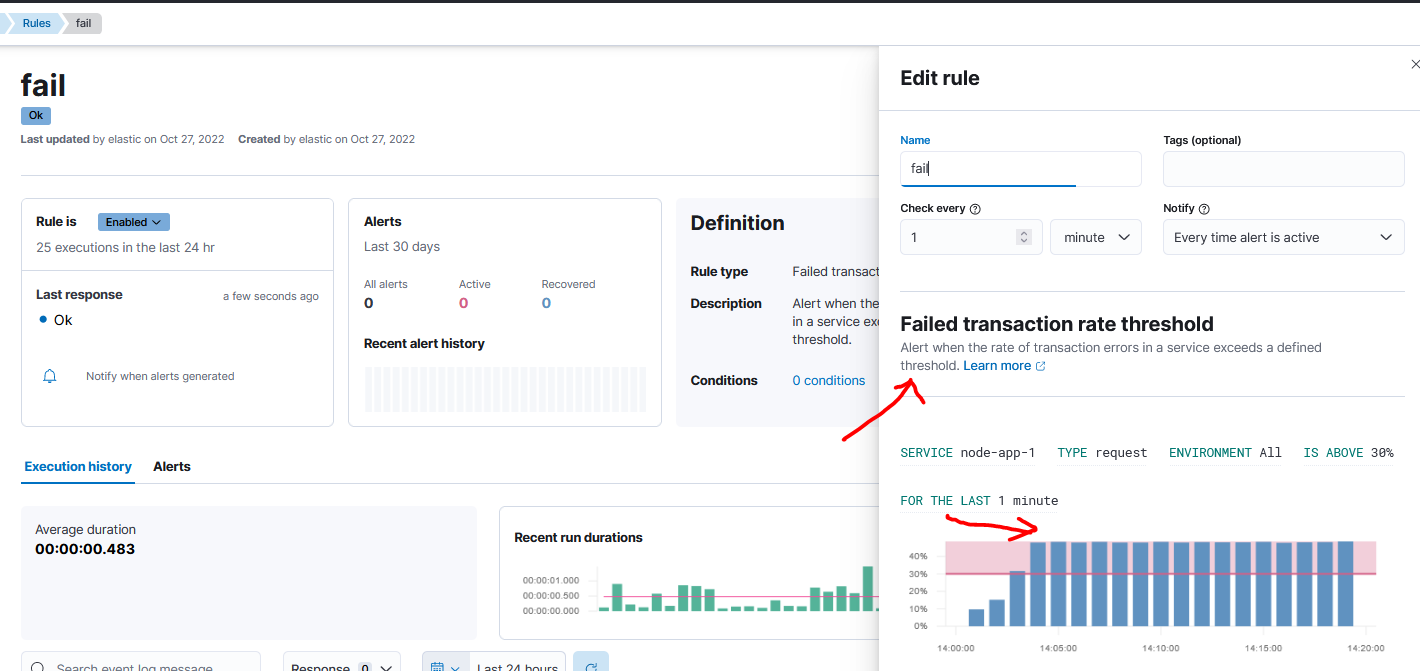
But the status is always "Ok". How do I get the status to "Active"? See screenshot below:

UPDATE
It's been about 7 hours since I posted the question above, which is also the time I started the rule. As of now, I see that the Failed Transaction Rate Threshold was only triggered 11 times and it recovered 11 times, as shown in this image:
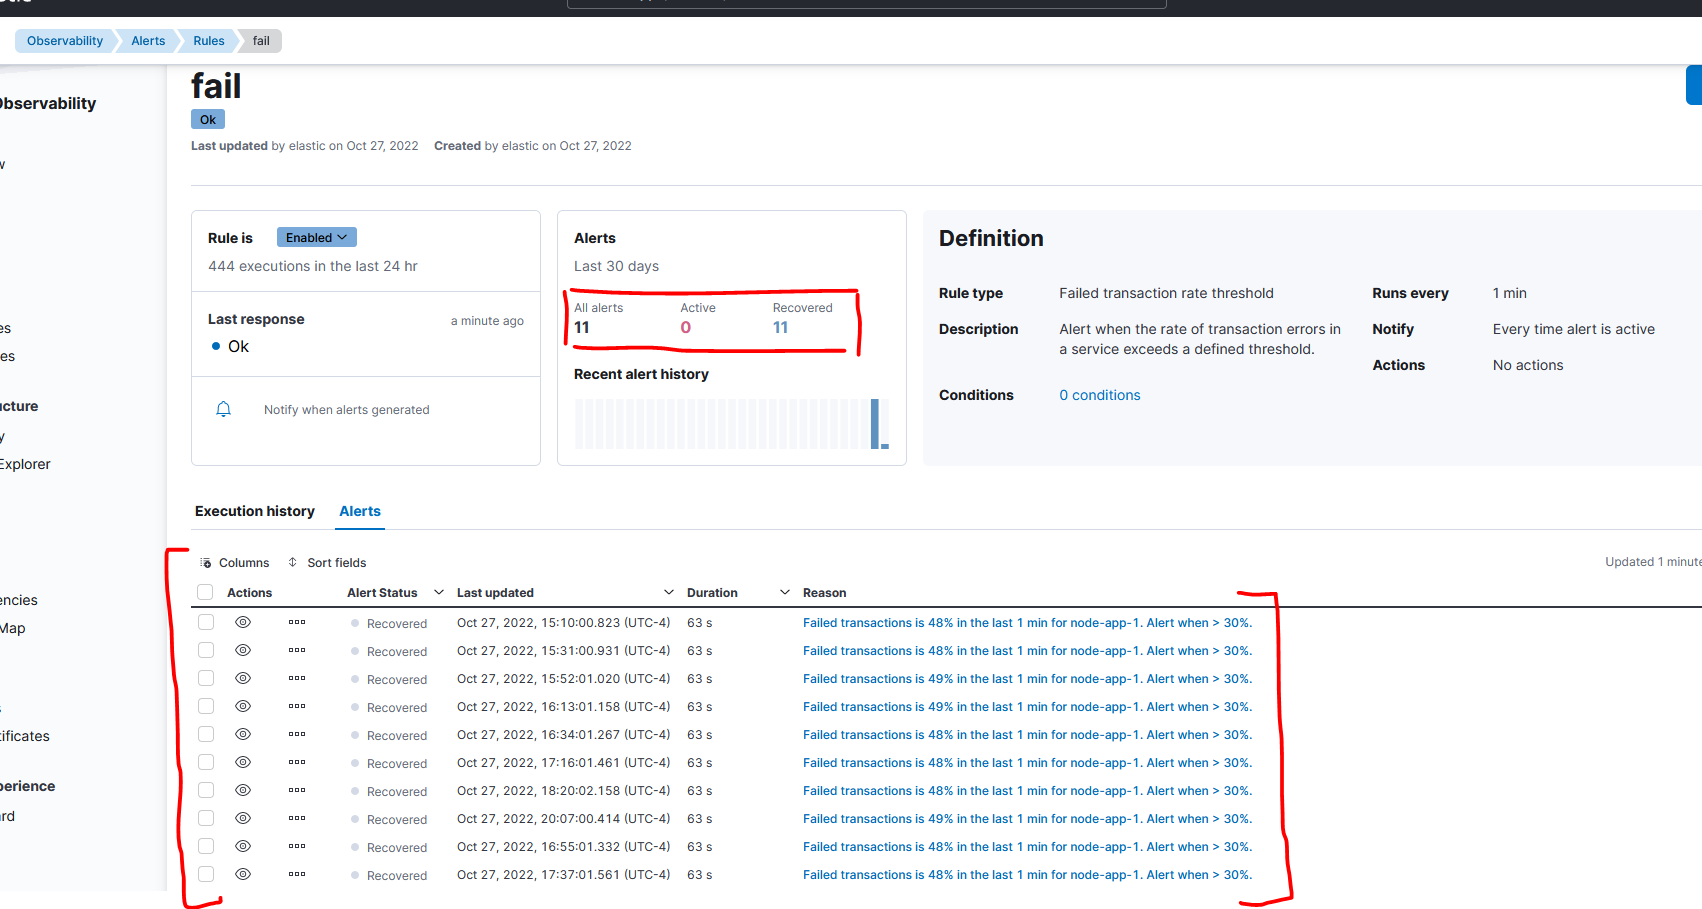
But I can see that the failure rate was consistently 48% during the past 7 hours:

Why does the alert rule say it recovered?
