How CPU and memory and disk usage are consumed when we keep running Logstash as a log receiver/compressor/transmitter and increase the amount of log?

How CPU and memory and disk usage are utilized when we keep running Logstash as a log receiver/compressor/transmitter and increase the amount of input log?

I watch/maintain a server where only one logstash runs and receiver logs from quite a few clients (sending logs with beats through logstash to the server) through the internet. Watching the server performance, I was wondering how the cpu and memory utilization changes as the number of logs and clients increases.

Here are the utilization pictures showing the current on-premise server's utilization.


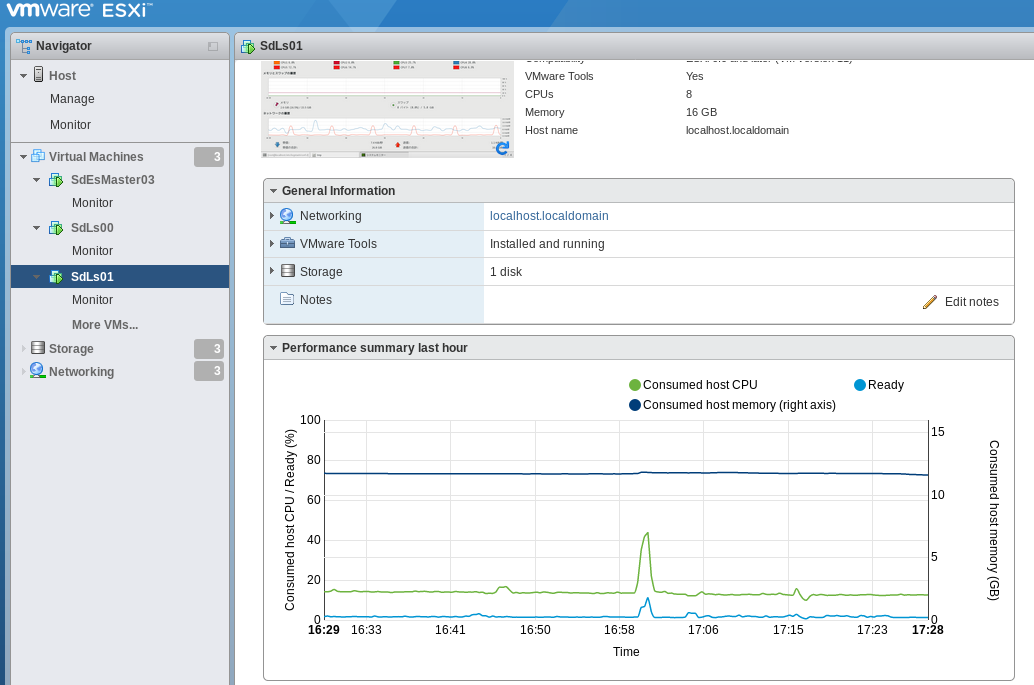
For now, the server receives log in real time, output the log as a file every second by logstash, zip the log files and forward to the local NAS and restart logstash every hour.

Here are the utilization pictures showing the aws cloud server's utilization that I am developing.


In the pictures above, the cloud server receives log in real time, output the log as a file every 30 seconds by logstash, zip the log files and forward to the S3 every 30 seconds.

0-1 In general, how does logstash consume/utilize memory and CPU resource according to the amount of data input/output?

0-2 To begin with, how does logstash temporarily store the logs received? Does it store on computer's memory?

0-3 Does CPU usage increases as logstash receives more log, or does CPU usage depends only on how frequently output the received logs?

1 While I guess it may depend on how I configure logstash.conf especially on the frequency of forwarding logs, how (much) does the memory utilization change (increase) when the server receives much more logs than it does now or it is capable of? Does it just slow down or crash?

2 While I guess it may depend on how I configure logstash.conf especially on the frequency of forwarding logs, how (much) does the CPU utilization change (increase) when the server receives much more logs than it does now or it is capable of? Does it just slow down or crash?

3 Why does the memory utilization not change even though the amount of logs received changed by time more or less on the on-premise server? Does logstash reserve some memory when it starts (and increases the allocated memory when logstash has to tentatively store the logs more than it can with the initially reserved memory)?

I you wanna more information to answer the questions, feel free to let me know.

Thank you.

Logstash is multi-threaded. Each input type defines its own threading mechanism. The beats input has a thread pool and the Beats protocol can communicate back-pressure to the upstream beats if it detects filter/output congestion.

The filters and output code is executed in the thread context of a worker. Worker count is set in logstash.yml

There is a synchronous in-memory queue (of 1000 entries) between the input thread(s) and the worker threads. If the input threads can't put a Logstash Event into the queue because it is full the thread will WAIT on the queue and consumes no CPU while waiting. The queue fills up when the workers are all busy executing filter or output code and cannot remove items from the queue.

Inputs are mostly network based so are a mix of IO and computation (as well as the WAIT on the queue).

Filters are either computational only (grok, dissect, kv, csv) or do some IO and some computation and when they wait on IO (network responses) they consume no CPU otherwise the use as much CPU time as the OS/Java scheduler will give them.

Outputs are mostly network based so are a mix as well except that they will retry a network operation until they succeed in their task of getting the data written downstream (this is a major cause of worker threads stalling and not being able to remove items from the queue).

Memory consumption is largely a function of how many events are in memory at any given time times the size of the strings in the events. Out of the box 8 workers X 125 events in a batch = 1000 events in the filter/output stages. Metrics type events are small but log lines (with stacktraces) can be quite large. Other events coming via JDBC can be any size.

Initial memory is determined by the JVM settings in the jvm.options file (1GB by default).

With this understanding, I'm sure you will agree that it is quite hard to make definitive statements about the dynamic CPU/memory profile of Logstash.

The Logstash monitoring REST API can give you insights on the behaviour of the LS internals. You can calculate peak memory needs by getting the size distribution of you events and estimating the small vs large size mix in any given batch and doing the maths with batch size and worker count.

2 Likes

I was able to do some stress testing when we started ingesting some sizable logs with the filebeat "ignore_older: 72h" option. Our logstash config has multiple pipelines, these logs were processed by one of them.

Changing the number of pipeline workers impacted thruput (events/second) and CPU. Each worker would consume nearly one processor (physical hardware). Memory usage didn't change noticeably.

There were 12-18 filebeat servers sending to 6 logstash servers sending to the same index. I tested ingest up to about 4-5x my "normal" rate load for that index.

1 Like

Thank you so much for sharing your experience, rugenl!

Changing the number of pipeline workers impacted thruput (events/second) and CPU. Each worker would consume nearly one processor (physical hardware). Memory usage didn't change noticeably.

Good information! Now I understand memory usage would not change so much even if we increase the number of workers as long as the amount of events (the log data sent from the upstream beats) does not change (i hope you understand correctly).

I really appreciate your detailed reply. I am getting to understand the design and internal mechanism of logstash.

I have got 3 more questions from your reply and a new test for disk usage with logstash. I was hoping you could answer then as well when you have time.

1

Memory consumption is largely a function of how many events are in memory at any given time times the size of the strings in the events.

Assuming "events" means the logs sent from the end point in my case (I hope I understand correctly), when the events were sent by the output code at logstash.conf, are they immediately gonna be deleted from the memory?

2

Out of the box 8 workers X 125 events in a batch = 1000 events in the filter/output stages.

Is it possible to change the 1000 total events limitation and/or 125 events per worker (= core by default) ? If yes, how? (e.g. if I assign 16 cores to logstash, does the in-memory queue become 2000 (= 16 X 125), or 1000 (16 X 62.5)?)

3
As mentioned above, I did another experiment to reveal how disk space is consumed, and got the following result.


The first picture displays the memory utilization (%), available memory space (MB) and the disk utilization (%) of two identical servers where logstash is running on a container, and the second one shows only the disk utilization (%). I took around 2 days to collect this data. I made the servers keep running all the time. My question is why the disk utilization is randomly keep increasing little by little (is it cache, congested log, kind of meta-log of logstash itself, or anything else? ), and how we can delete the increased data?

Assuming "events" means the logs sent from the end point in my case (I hope I understand correctly), when the events were sent by the output code at logstash.conf, are they immediately gonna be deleted from the memory?

Event is the term Logstash documents use to describe the unit of processing within Logstash. For example the file input breaks up text content into lines, each one being an Event and the TCP input receives a network packet and that data becomes an Event.
Events are assembled into a Batch (just an array) and are passed into the worker thread, by default a batch is 125 events but this can grow with the clone or split filters and shrink with the drop filter. Batches can also be split into two parts, those events that satisfy a conditional clause and those that don't, each part being fed into a conditional branch filter set and recombined after the whole branch is executed. Memory references to the Events are held in the batch array. After all output processing the array goes out of execution scope and it and the events become eligible for Java garbage collection.

Is it possible to change the 1000 total events limitation and/or 125 events per worker (= core by default) ? Is yes, how? (e.g. if I assign 16 cores to logstash, does the in-memory queue becomes 2000 (= 16 X 125), or 1000 (16 X 62.5)?)

Yes, Logstash allows you to do almost anything. Read up here on pipeline.workers and pipeline.batch.size

My question is why the disk utilization is randomly keep increasing little by little

Logstash writes its own logs (using Java log4j) that get rotated and zipped. These can be deleted, oldest first, if space is needed. Some plugins write small files to keep state. OS level services might keep a record of STDOUT and STDERR. Lastly, the persistent queue feature writes Events to disk after receiving them from the input stage. The persistent queue is not enabled by default.

2 Likes

Thank you very much for your prompt response!
I have got to understand the concept of events and how logstash occupy the disk and how to release it. I will discuss with the other team members based on your great information.

1 Like

This topic was automatically closed 28 days after the last reply. New replies are no longer allowed.