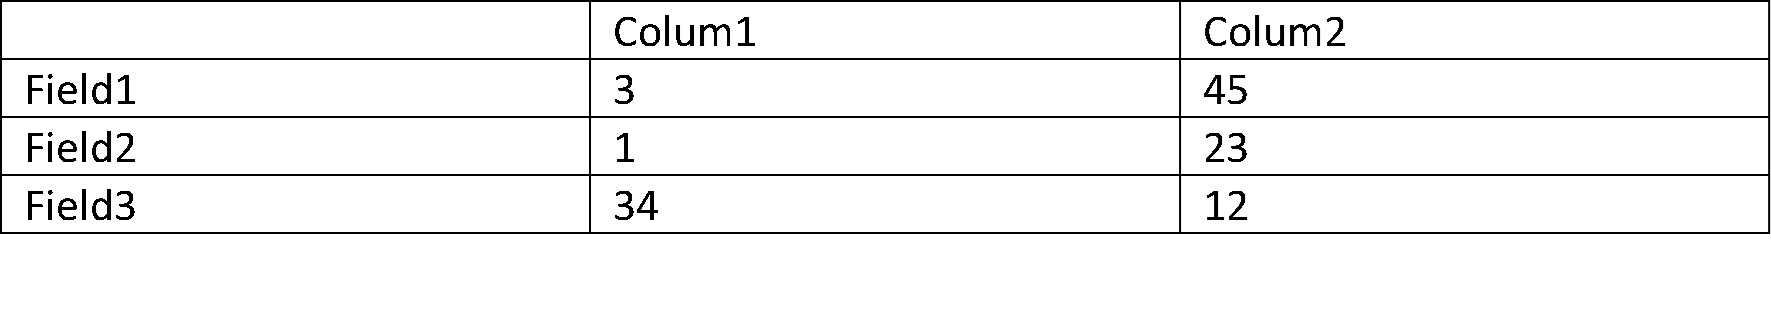
I have an array of fields that I have already put in the form of columns, but my concern is that the count() appears as a metric at the bottom, but I need the date to appear, instead of count()
Could you provide some example documents?; so we could suggest to you what metric, transformation, or scripted field could help you get the desired results.
I don' think this is possible in Kibana (But I could be wrong), mainly because you are looking for a row to columns operation; that is something I haven't seen in Elastic DSL or any of the aggregations. However, it could be possible with some post-processing in your specific language or a SQL query (In Canvas, for example).
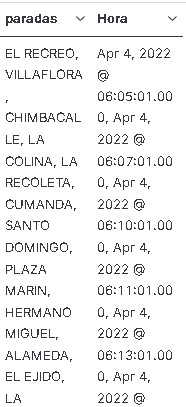
Look, with kibana lens I was able to remove the stop column horizontally, but now the problem is that the counter appears below and I want the time to appear
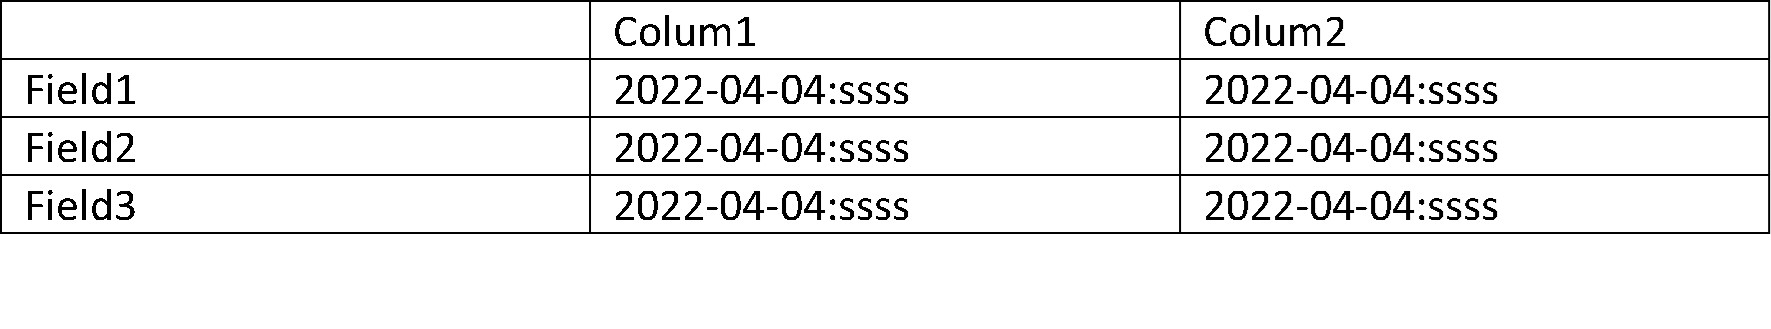
Using your example data and a dynamic field in the data view; it's possible to get something like what you are expecting; however, given that I'm using a metric (last value), it seems to me that this is not really a solution, but a workaround with a lot of downsides:
In my mind, at least, the transposition that you are trying to perform should be something more like this (Sorry if I'm breaking any rules for posting other tool screenshots):
Grafana, the query depicted in the screenshot and a "Rows to Fields" transformation, but you should try SQL in a Canvas; I'm sure that is an excellent option, and it's possible to get your visualization using SQL.
Apache, Apache Lucene, Apache Hadoop, Hadoop, HDFS and the yellow elephant
logo are trademarks of the
Apache Software Foundation
in the United States and/or other countries.