I've created a data histogram chart based in a formula where I'm expecting to analyze the amount of requests per device. However. I'd like to plot in the same chart a static line with the average around that day.
The formula I'm using for y-axis is: count()/unique_count(guid)
and in x-axis I choose to analyze one day.
What I want now is to plot a static line the the average of these formula in that day.
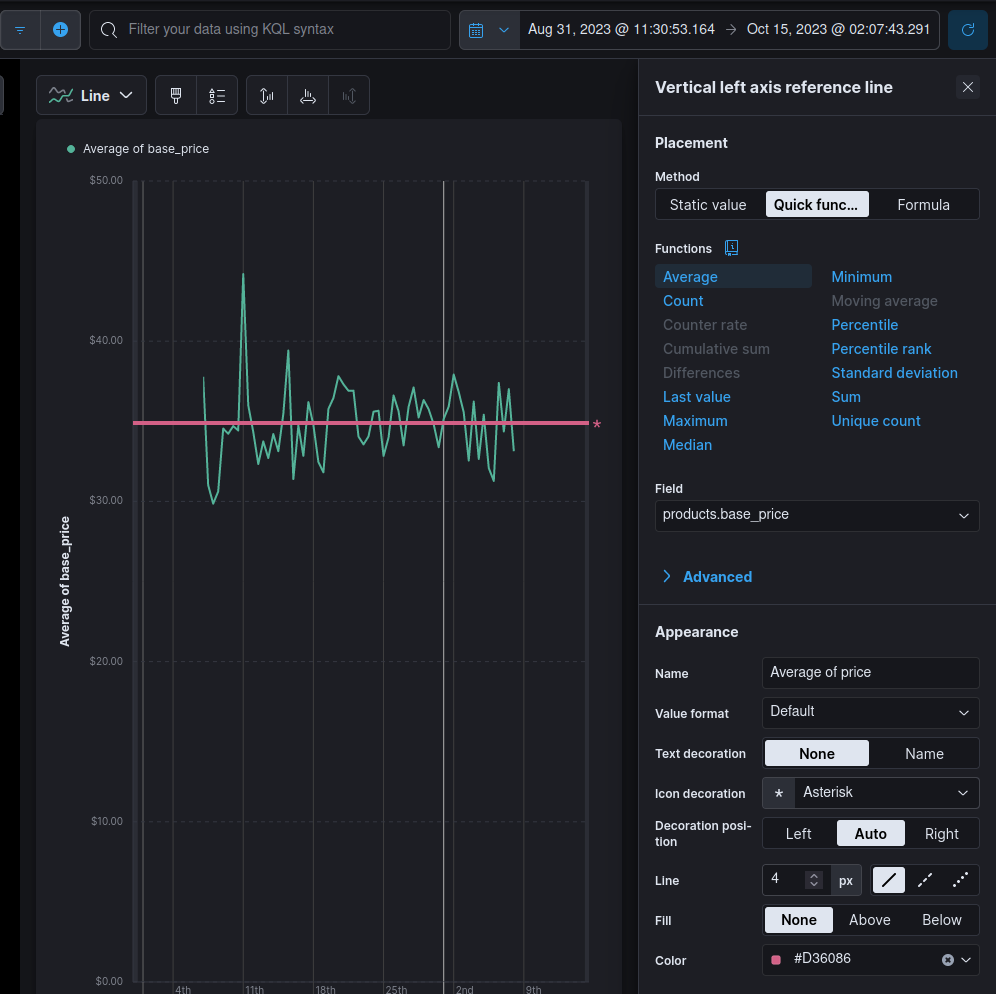
In Lens, you can add a new layer with the "Reference Lines" type. This type accepts a static value, but also the result of a quick function or a custom formula.
I'm aware about this possibility. Thanks for share.
But here the problem is that I cannot apply a average because the metric used for plot the histogram is a formula count()/unique_count(guid). So when I use average I'm forced to chose the field I want to know the average but what I want is to know the average of the normalized value, in this case count()/unique_count().
You can use formulas in the reference lines, but if I'm understanding you correctly, what you miss is the correct data for that formula since the reference line take the aggregated of the chart as the only input available.
Maybe you can give Vega a try? There you have much more flexibility but you need to craft the correct query (the Inspect tool in Kibana can help with that!) and after that, compose the correct transformation of your data to finally decide the rendering.
Apache, Apache Lucene, Apache Hadoop, Hadoop, HDFS and the yellow elephant
logo are trademarks of the
Apache Software Foundation
in the United States and/or other countries.