How to calculate max qps with a nginx log index by a kibana visualization?

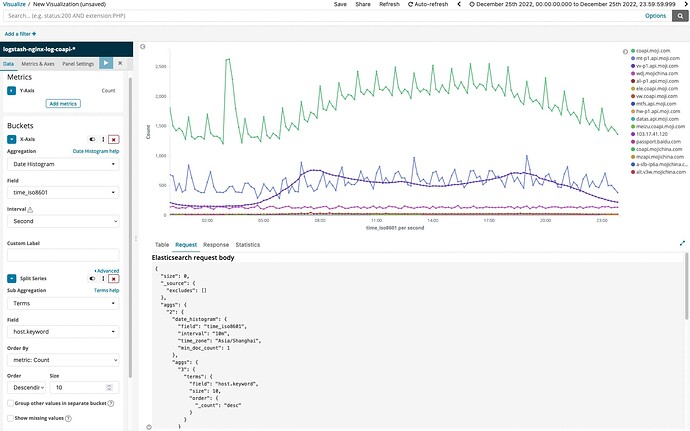
I create a line type visualization like below, and I don't know how to aggregate the buckets and get the max value.

Here is the request body:

{
  "size": 0,
  "_source": {
    "excludes": []
  },
  "aggs": {
    "2": {
      "date_histogram": {
        "field": "time_iso8601",
        "interval": "1s",
        "time_zone": "Asia/Shanghai",
        "min_doc_count": 1
      },
      "aggs": {
        "3": {
          "terms": {
            "field": "host.keyword",
            "size": 10,
            "order": {
              "_count": "desc"
            }
          }
        }
      }
    }
  },
  "stored_fields": [
    "*"
  ],
  "script_fields": {},
  "docvalue_fields": [
    "@timestamp",
    "time_iso8601"
  ],
  "query": {
    "bool": {
      "must": [
        {
          "match_all": {}
        },
        {
          "range": {
            "time_iso8601": {
              "gte": 1671897600000,
              "lte": 1671983999999,
              "format": "epoch_millis"
            }
          }
        }
      ],
      "filter": [],
      "should": [],
      "must_not": []
    }
  }
}
You will need to provide more detail here. You need what max value? Can you give an example based on that screenshot?

The max or peak value of every line...

I don't know if line type is suitable here, maybe I should use another type.

This topic was automatically closed 28 days after the last reply. New replies are no longer allowed.