Hi
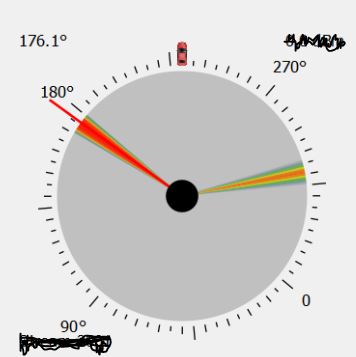
I want to create a polar chart using data with degree 0-360° and plot some line (aggregated as heatmap line).
then, I would like to filter on it (for example in the North, from 330° to 30°).
how can I create something like that on kibana?
thanks