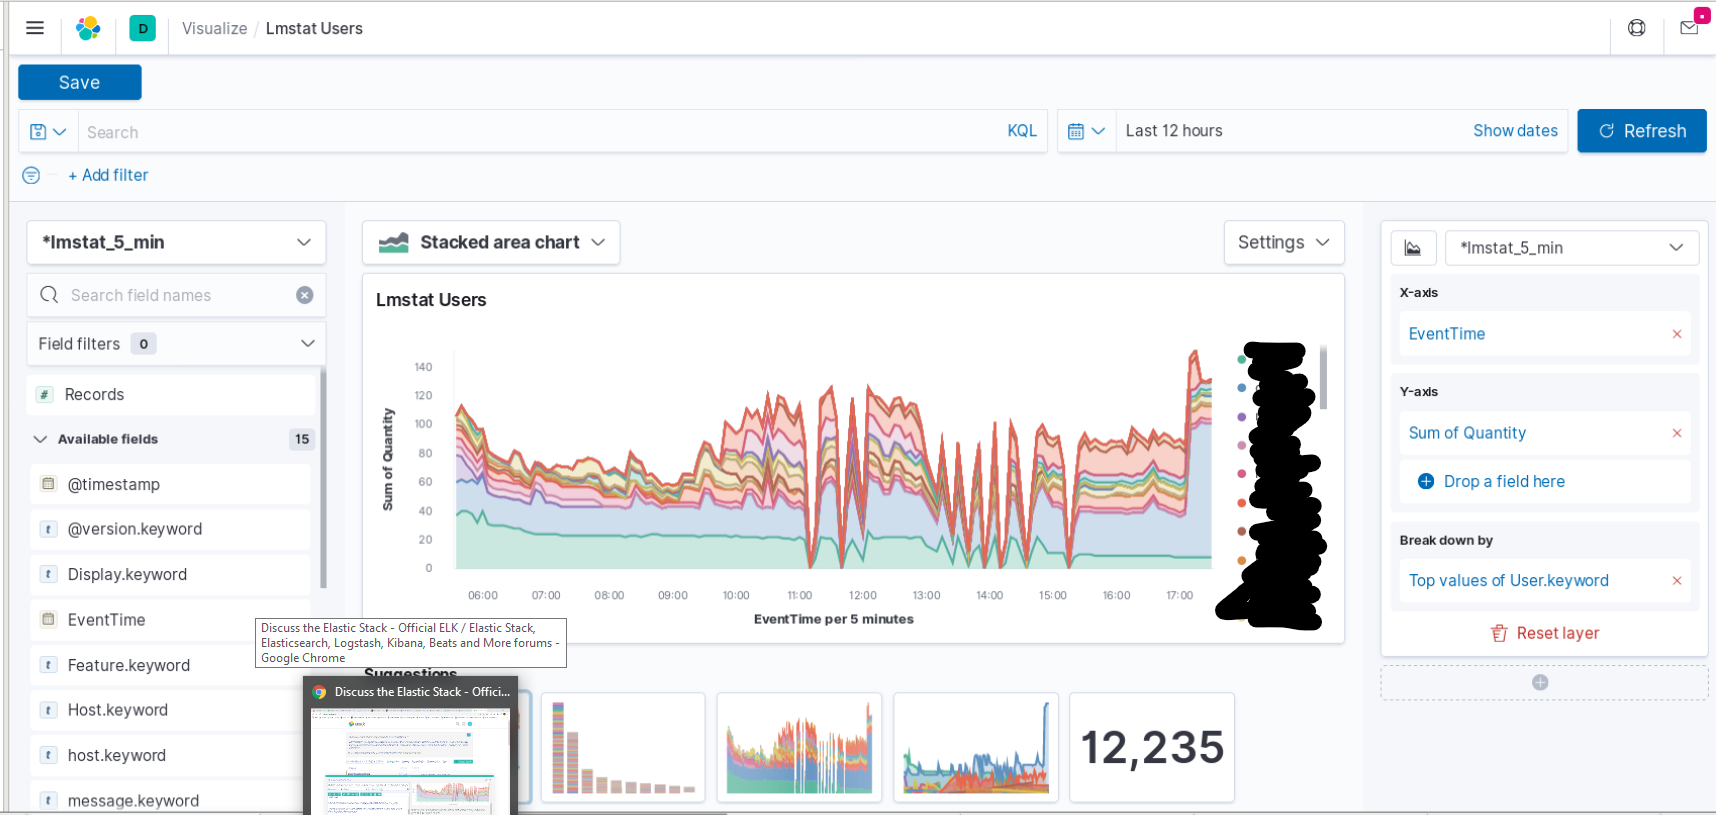
I am certain this question has been asked many times before but I don't understand the answer(s) given because I am using Kibana Lens to create my graph and because I am a rank beginner. I have data sampled every 5 minutes that comes from Flexera lmstat. The data contains who has licenses checked out at every 5-minute interval. When I graph the data (using Lens) I get precisely what I want - IF the event time interval I select is also 5 minutes. If I zoom out to a larger time window and the event time interval is for example 10 minutes then the values are all 2x the height they should be. This is because there are two 5 minute intervals in 10 minutes so the data from both intervals are added together! I want them added together and then divided by 2. If I zoom out to an hour event time interval then the sums should be divided by 12. I of course want this dividing to happen automatically for me. Here's the Lens visualization I am discussing. Again - it's just what I want in this instance because I selected a 12 hour window which gives me 5 minute event time intervals:
Hi, I work on Lens. There are very similar use cases that we're considering supporting in the future, but I think yours has a simple answer. You said:
This is because there are two 5 minute intervals in 10 minutes so the data from both intervals are added together! I want them added together and then divided by 2.
This means that you want the average of the field, not the sum.
Hi Wylie, thanks for responding! One thing I didn't make clear enough is this: for any given sample (again, samples are taken every five minutes) I may have many checkouts of a given license feature for user Moe and many for Larry and many for Curley. Moe may have a five entries - two licenses on one host, one license on each of three other hosts and three on yet another host. If we assume he has the same number of licenses checked out for the two five-minute intervals in the ten-minute event time (sorry if I'm getting the terminology wrong), then the average foe Moe would be (2 + 1 + 1 + 1 + 3 + 2 + 1 + 1 + 1 + 3) / 10. Or 1.6 licenses. The answer I want is (2 + 1 + 1 +1 + 3 + 2 + 1 + 1 + 1 + 3) / 2 which is 8. In other words Moe has an AVERAGE of 8 total (that is to say a SUM or all of the licenses he has checked out per sample) licenses checked out at a time. Does that make sense?
If I understand you correctly you are looking for a second level of aggregation. Lens does not support this, but there might be a workaround. Basically it sounds like you need "entity-centric" data instead of event-oriented data. The simplest way of doing this is to set up a continuous transformation in Elasticsearch, where you can:
Group by entity ID
Group by timestamp if you want
Calculate some metrics for each entity
Then you can build a visualization based on the pre-aggregated data
Okay thanks Wylie - I'll look into that. I was considering modifying my input data (either on the way to Logstash or in Logstash itself. But it's good to know I can do the transformation in place in Elasticsearch.
Apache, Apache Lucene, Apache Hadoop, Hadoop, HDFS and the yellow elephant
logo are trademarks of the
Apache Software Foundation
in the United States and/or other countries.