Hi,
I'm interested in making the trending chart from this page:https://www.elastic.co/blog/custom-vega-visualizations-in-kibana
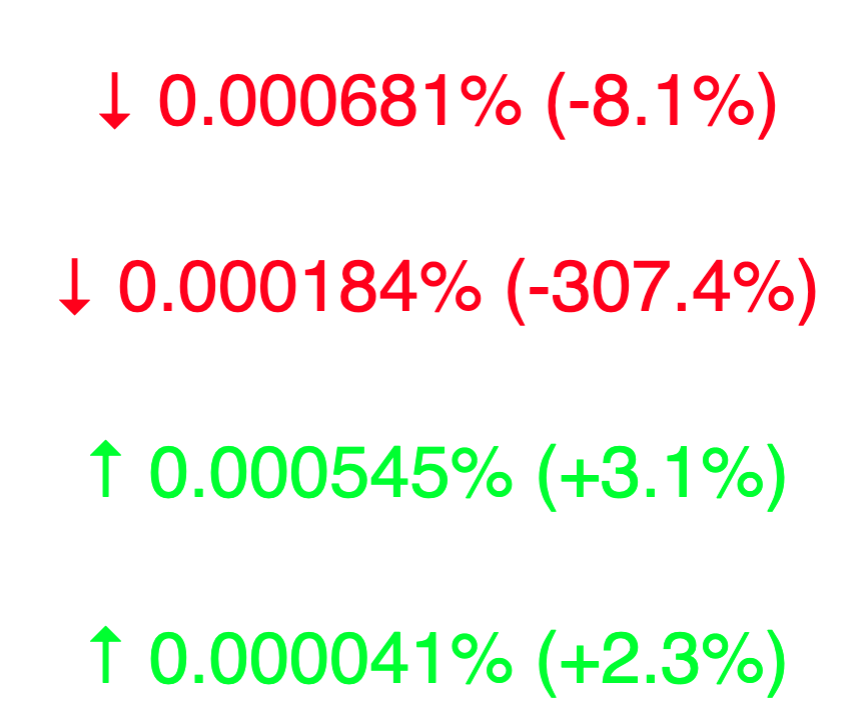
I'm not only creating one trendline, but I'm tracking several different trends at the same time and so I imported a couple more fields into vega to make those calculations. The only thing left is that I have 4 different trends that I'm tracking and I'd like to have a title to designate what the number means for each of the 4 trends I have. If I have multiple "marks" how can I create a title for each?
This is my code:
marks: [
    {

      type: text
      # Text mark executes once for each of the values in the results,
      # but results has just one value in it. We could have also used it
      # to draw a list of values.
      from: {data: "results"}
      encode: {
        update: {

          # Combine the symbol, last value, and the formatted percentage
          # change into a string
          text: {
            signal: "datum.s1w1symbol + ' ' + format(datum.s1w1last, '%') + ' ('+ format(datum.s1w1percentChange, '+.1%') + ')'"

          }
          # decide which color to use, depending on the value
          # being up, down, or unchanged
          fill: {
            signal: if(datum.s1w1up, '#00ff00', if(datum.s1w1down, '#ff0000', '#0000ff'))

          }
          # positioning the text in the center of the window
          align: {value: "center"}
          baseline: {value: "middle"}
          xc: {signal: "width/2"}
          yc: {signal: "height/4"}

          # Make the size of the font adjust with the size of the visualization
          fontSize: {signal: "min(width/10, height)/1.3"}

        }
      }
    },
    {

      type: text
      # Text mark executes once for each of the values in the results,
      # but results has just one value in it. We could have also used it
      # to draw a list of values.
      from: {data: "results"}
      encode: {
        update: {

          # Combine the symbol, last value, and the formatted percentage
          # change into a string
          text: {
            signal: "datum.s1w2symbol + ' ' + format(datum.s1w2last, '%') + ' ('+ format(datum.s1w2percentChange, '+.1%') + ')'"

          }
          # decide which color to use, depending on the value
          # being up, down, or unchanged
          fill: {
            signal: if(datum.s1w2up, '#00ff00', if(datum.s1w2down, '#ff0000', '#0000ff'))

          }
          # positioning the text in the center of the window
          align: {value: "center"}
          baseline: {value: "middle"}
          xc: {signal: "width/2"}
          yc: {signal: "height/2"}

          # Make the size of the font adjust with the size of the visualization
          fontSize: {signal: "min(width/10, height)/1.3"}

        }
      }
    }
...
    ```