How to get index data into custom visualization?

I am trying to create a new custom Kibana visualization in version 6.5.

Based off of examples and blogs posts, I have managed to create a bare bones visualization, but I am unsure how to retrieve data from an elastic index and use it in my visualization (based on the time period chosen).

On most kibana visualizations, once you click the visualization you want, it displays a page showing a list of indices to chose from, how do I integrate that into my work? Right now when I choose my visualization, it just goes directly to the the visualization and displays a plot with some hard coded data.

I know you can setup a route to call ES, which I have tried and been able to get to work, which simply returns the metadata from elastic (such as the indices names), but I haven't found any examples that simply show how to display that list of indices to choose from, and that then queries the index for the data for the chosen time (say the default "Last 15 minutes", and then returns it. Once I have the data, I know displaying it on my custom graph will be easy, but I can't find any examples that show how to retrieve it.

Below is a picture of my current visualization, which is a skyplot with hard coded data. This is what displays immediately after clicking the the icon for it on the creation page. The other image is the what displays with other visualisations (i.e. the choose index page). How do I integrate this into my visualization, so that it will pass back the data into my visualization?

I have read this similar post, along with this documentation about request handlers. Is there an example someone can point me that shows how to implement a simple request handler?

@reillye It depends on your particular needs, but generally speaking we recommend people use the default courier request handler in conjunction with the default vis editor, as they are able to address most use cases and remove the need for you to worry about querying infrastructure.

Are you finding that the courier request handler is not sufficient for your needs? If you are curious, you can look at the implementation of the courier request handler itself, as it provides an example of how the handlers are structured & registered.

@lukeelmers Thanks! Adding courier as my request handler has resolved the issue of displaying the indices. I didn't realise it took care of displaying the pages, I thought there was additional code needed to call those.

How exactly do I extract the data from courier to display on my visualisation? As in, how do I pass the data into my react component for the visualisation?

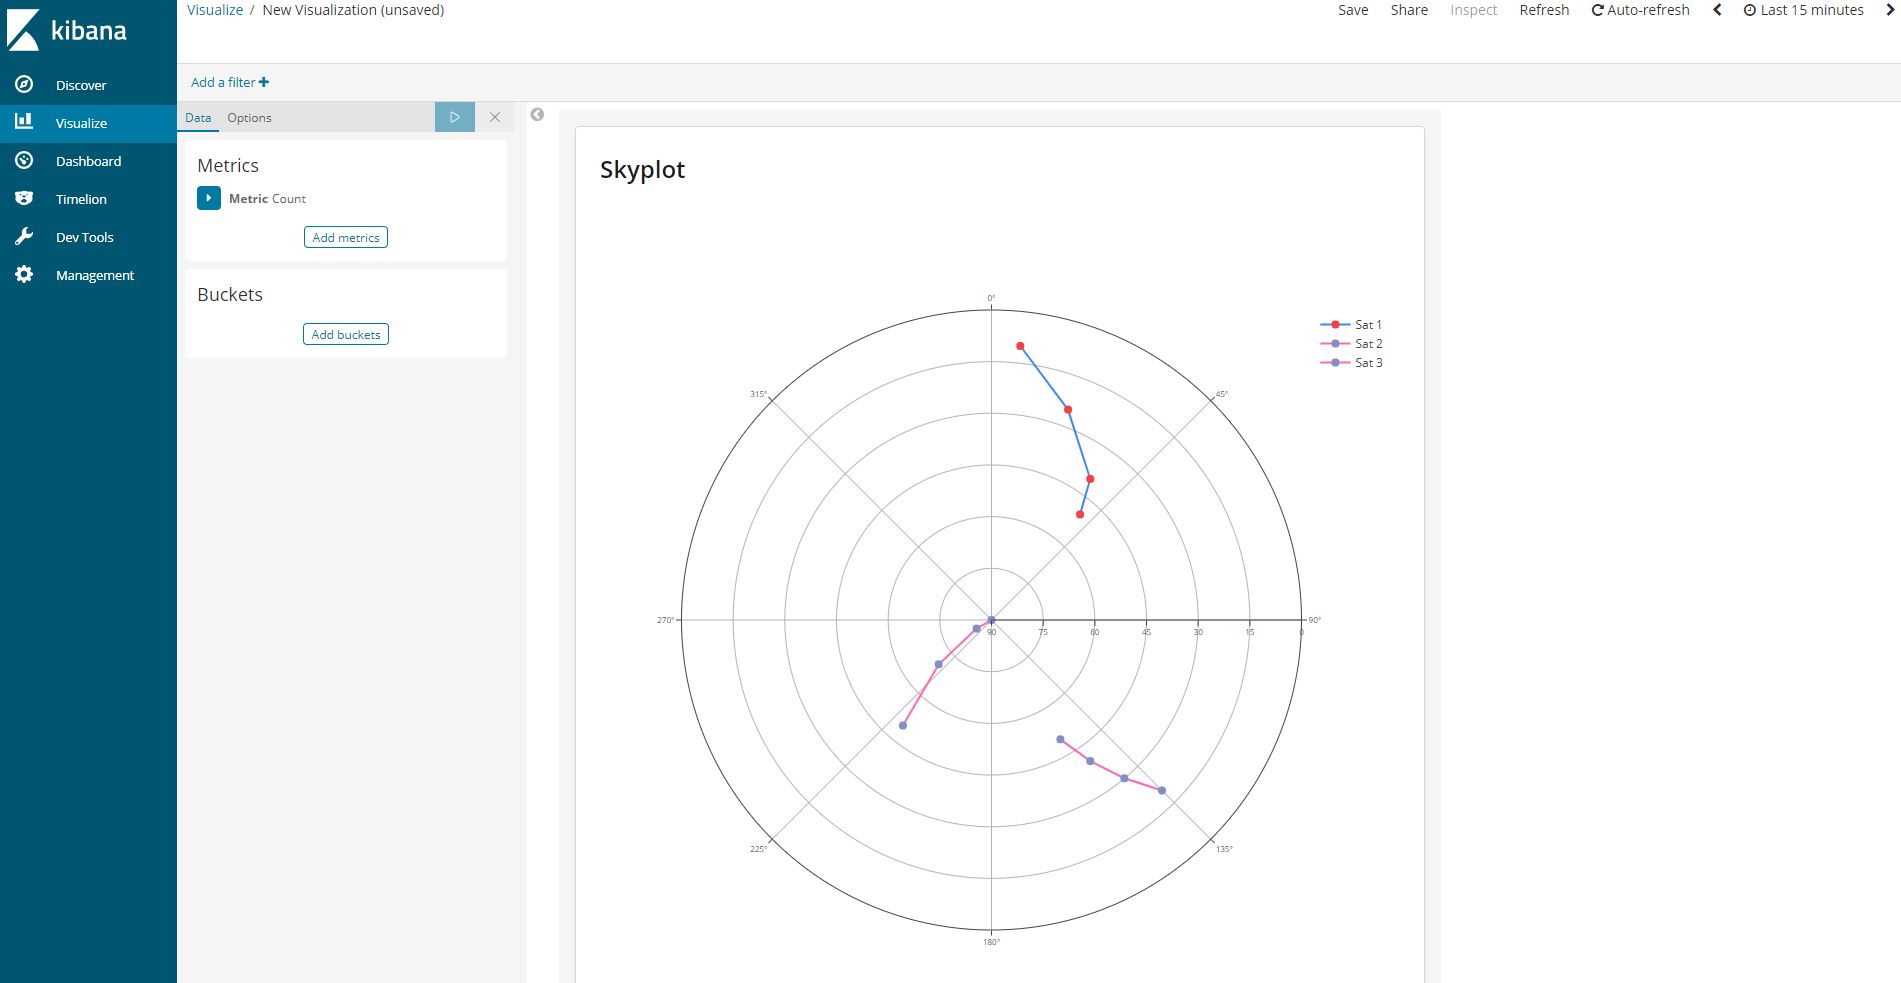
@lukeelmers I've added some code below of my component and where the visualisation is initialized. In my component self_changing_component.js, my plot uses a data variable which is currently set to some hard coded data. In this class, how can I extract the response from the courier call, and use the data from it instead? Are there examples/documentation of doing so I can follow?

My Code:
self_changing_vis.js

import { VisFactoryProvider } from 'ui/vis/vis_factory';
import { VisTypesRegistryProvider } from 'ui/registry/vis_types';

import { SelfChangingEditor } from './self_changing_editor';
import { SelfChangingComponent } from './self_changing_components';

import { Schemas } from 'ui/vis/editors/default/schemas';
import optionsTemplate from './options_template.html';


function SelfChangingVisType(Private) {
  const VisFactory = Private(VisFactoryProvider);

  return VisFactory.createReactVisualization({
    name: 'self_changing_vis',
    title: 'Skyplot',
    icon: 'visControls',
    description: 'This visualization is able to change its own settings, that you could also set in the editor.',
    visConfig: {
      component: SelfChangingComponent,
      defaults: {
        counter: 0,
      },
    },
    editor: 'default',
    editorConfig: {
      optionsTemplate: optionsTemplate,
      schemas: new Schemas([
        {
          group: 'metrics',
          name: 'metric',
          title: 'Metric',
          min: 1,
          aggFilter: ['!derivative', '!geo_centroid'],
          defaults: [
            { type: 'count', schema: 'metric' }
          ]
        }, {
          group: 'buckets',
          name: 'segment',
          title: 'Bucket Split',
          min: 0,
          max: 1,
          aggFilter: ['!geohash_grid', '!filter']
        }
      ]),
    },
    requestHandler: 'courier',
  });
}

VisTypesRegistryProvider.register(SelfChangingVisType);

self_changing_component

import React from 'react';
import Plot from 'react-plotly.js';
import {
  EuiPage,
  EuiPageHeader,
  EuiTitle,
  EuiPageBody,
  EuiPageContent,
  EuiPageContentHeader,
  EuiPageContentBody,
  EuiText
} from '@elastic/eui';

const skyplotData = [
  {
    type: 'scatterpolar',
    mode: 'lines+markers',
    name: 'Sat 1',
    r: [10, 25, 40, 50], //Elevation
    theta: [6, 20, 35, 40], //Azimuth
    line: {
      color: '#4286f4'
    },
    marker: {
      color: '#f44141',
      symbol: 'circle',
      size: 8
    },
  },
  {
    type: 'scatterpolar',
    mode: 'lines+markers',
    name: 'Sat 2',
    r: [20, 30, 40, 50],
    theta: [135, 140, 145, 150],
    line: {
      color: '#ff66ab'
    },
    marker: {
      color: '#8090c7',
      symbol: 'circle',
      size: 8
    },
  },
  {
    type: 'scatterpolar',
    mode: 'lines+markers',
    name: 'Sat 3',
    r: [50, 70, 85, 90],
    theta: [220, 230, 240, 250],
    line: {
      color: '#ff66ab'
    },
    marker: {
      color: '#8090c7',
      symbol: 'circle',
      size: 8
    },
  },
];

const plotLayout = {
  showlegend: true,
  width: 800, height: 800,
  polar: {
    radialaxis: {
      range: [90, 0], //Sets x axis range. Default is 0 to largest value in the dataset
      tickmode: 'array',
      tickvals: [90, 75, 60, 45, 30, 15, 0], //Sets how many ticks to show on the plot
      tickfont: {
        size: 8
      }
    },
    angularaxis: {
      tickfont: {
        size: 8
      },
      direction: 'clockwise'
    }
  }
};

const plotConfig = { displayModeBar: false }; //Hides options to zoom, screenshot etc.

export class SelfChangingComponent extends React.Component {
  constructor(props) {
    super(props);
    this.state = { skyplotData, plotLayout, plotConfig }; //Set the skyplot data in the component state
  }

  onClick = () => {
    this.props.vis.params.counter++;
    this.props.vis.updateState();
  }

  render() {
    return (
      <EuiPage>
        <EuiPageBody>
          <EuiPageContent>
            <EuiPageContentHeader>
              <EuiTitle>
                <h2>Skyplot</h2>
              </EuiTitle>
            </EuiPageContentHeader>
            <EuiPageContentBody>
              <Plot
                data={this.state.skyplotData}
                layout={this.state.plotLayout}
                config={this.state.plotConfig}
              />
            </EuiPageContentBody>
          </EuiPageContent>
        </EuiPageBody>
      </EuiPage>
    );
  }

  componentDidMount() {
    this.props.renderComplete();
  }

  componentDidUpdate() {
    this.props.renderComplete();
  }
}

@lukeelmers After doing some additional research and debugging using the react developer console on Kibana, I can see that a a visData prop gets passed down to my component, but I'm confused by the format of it.

Reading the documentation on response handlers hasn't clarified much for me. I appear to be using the default response handler, but it is not returning data as I would expect. The documentation states the default handler returns data in two array formats, columns and rows, but neither of these contain the information I need to populate my visualisation.

My index is structured like so:

{
  "observed_range_error" : {
    "aliases" : { },
    "mappings" : {
      "observed_range_error" : {
        "properties" : {
          "azimuth" : {
            "type" : "double"
          },
          "constellation" : {
            "type" : "keyword"
          },
          "elevation" : {
            "type" : "double"
          },
          "gms" : {
            "type" : "keyword"
          },
          "satelliteId" : {
            "type" : "keyword"
          },
          "signalId" : {
            "type" : "keyword"
          },
          "timestamp" : {
            "type" : "date"
          },
          "ure" : {
            "type" : "double"
          }
        }
      }
    }
}

And in order to populate my visualisation, I need to extract the azimuth,elevation and satelliteId values for the given time period. Is there a way to do this with the default response handler? Or do I need to create a custom handler? If so, are there examples of custom response handlers in the code, as the example in the documentation does not state how to do this.

Assuming the ES response that comes back has the data you need, and it just gets lost in the default response handler, you could easily create your own.

If it is just a one-off response handler for your specific visualization, you can include it inline in the visualization definition:

return VisFactory.createReactVisualization({
  ...
  responseHandler: (response, dimensions) => {
    return new Promise(resolve => {
      // do stuff with the response
      resolve(response);
    });
  },
  ...
});

It's just a simple function that takes in the response (and optional dimensions) and returns a promise that resolves with the final data for your visualization.

You might also find it helpful to browse through the response handlers directory in the source.

@lukeelmers

Assuming the ES response that comes back has the data you need

This is my issue though. I'm using the default courier request handler, as you can see from my code above. This is returning the data in a format that looks like this:

I currently have one entry in that index, which the search does return as you can see by the total hits returned. However the hits: [] array is empty? I assume this is where I would be extracting the data from, because when I query the REST API directly in my browser using http://localhost:9200/observed_range_error/_search?&pretty, it returns the following:

{
  "took" : 84,
  "timed_out" : false,
  "_shards" : {
    "total" : 5,
    "successful" : 5,
    "skipped" : 0,
    "failed" : 0
  },
  "hits" : {
    "total" : 1,
    "max_score" : 1.0,
    "hits" : [
      {
        "_index" : "observed_range_error",
        "_type" : "_doc",
        "_id" : "GkD2U2oBKZkOEqkMt8yR",
        "_score" : 1.0,
        "_source" : {
          "constellation" : "GPS",
          "satelliteId" : "PRN:6",
          "timestamp" : "2019-04-23T14:17:11",
          "gms" : "RTCM_301",
          "ure" : "40.10",
          "elevation" : "20.01",
          "azimuth" : "160.50"
        }
      }
    ]
  }
}

As you can see, the hits array is populated there.

So my question is, why when using the courier request, is the hits array empty, despite the total hits being greater than 0? Is this just a limitation of the developer console, where it doesn't display the values? I don't see how I can extract the data I need from what is being returned to me at this point.

Also, when I tried to implement a custom response handler using the simple code you suggested:

responseHandler: (response, dimensions) => {
      return new Promise(resolve => {
        console.log('Response: ', response);
        console.log('Dimensions: ', dimensions);
        resolve(response);
      });
    },

The output looks like the following:

I don't understand how you extract the values in the index from this data? Where would it be located?

Thanks for the additional detail! I think I have a better understanding of what you're running into now.

The default visualization editor & courier request handler are based around visualizing aggregations, not individual documents. The reason you aren't getting any hits back is because in the search source that courier uses, we are setting size: 0 in the request, telling ES not to send back the actual source of each document in the payload, because it would be a waste of resources as the source for individual docs is irrelevant when visualizing the data in aggregate.

It sounds like you'll need your own custom request handler to accomplish what you are looking for (and possibly a response handler too depending on how much processing needs to happen on the response). There's a very basic empty request handler that doesn't make a request or resolve with any value, but you could use it as a point of reference. The arguments this handler will receive can be found here.

You can query ES from your handler however you'd like, for example with the legacy Elasticsearch client library that's packaged with Kibana by default. (There's also a newer version that hasn't been moved to Kibana yet).

Hope this helps a bit. Unfortunately the current experience for building custom visualizations can be difficult to follow, and could be much better documented. We are currently undergoing a larger initiative to make our vis development platform more robust, which will include a new data access layer that will provide a unified high-level abstraction for querying ES :slight_smile:

Thanks for the response, this is by far the most helpful information I've received yet. I will try to create my own requestHandler. Do you know where in the code base is the logic that displays that "choose search source" page? I would like to reuse that before adding my own logic to query es if possible. I know it appears when you add the requestHandler: 'courier' code, but I can't find the source for where it displays that page, or how it works in general.

Unfortunately the current experience for building custom visualizations can be difficult to follow, and could be much better documented

This would be greatly helped if it was possible for someone to publish a more up to date blog on creating custom visualisations, for something along the lines of what I am trying to do (a vis that simply queries es for docs and just displays them on the screen). Most of the resources with examples I've found are blogs that are 2-3 years old, and there seems to have been quite the change in the process since then. Even the more up to date code examples I have been able to find have been hidden in the source code in the most bizarre places, and I've only been able to find them thanks to people on this forum. I'd happily raise a ticket or a request for a more up to date blog on the process, if you could point me in a direction of somewhere to raise it, just so the ELK team are aware it would help developers :slight_smile:

Thanks for the feedback! The main reason we haven't been publishing up-to-date information on the vis development process is because a lot of it is changing over the course of version 7.x (7.0.0 was just released recently), and we'd prefer to give folks guidance on a longer-term solution for these things.

To answer your question on the search source, whether or not the "choose" dialog shows up depends on your request handler: it should appear as long as the request handler is set to anything but "none". Logic for that can be found in the source here and here.

There is also an options.showIndexSelection boolean that you can set in your visualization definition, but it defaults to true already so you shouldn't need to do anything there.

Ok, thank you for the help. I will try implementing my own handler, and I'll probably be back with more questions soon :slight_smile:

a lot of it is changing over the course of version 7.x (7.0.0 was just released recently), and we'd prefer to give folks guidance on a longer-term solution for these things.

Does this mean that there won't be an updated solution for awhile? If I understand you, you're saying that a lot is changing from 7.x onwards, which suggests there won't be any guides/blogs etc. about them for some time until the next minor version are released (e.g. having to wait until version 7.5 for the next one)?

This is sort of a roundabout answer to your question, but just some context:

The reason we are making a lot of changes during 7.x is because there's a large effort underway to migrate to a new core platform, which will provide a better development experience for folks building Kibana plugins. One of the goals of this new platform is clearer documentation for developers.

Visualizations are unique in that they provide an additional layer of abstraction on top of the standard plugin APIs, but we still officially consider those vis APIs to be internal/unstable.

However, since there lots of community members building custom visualizations, we want to do whatever we can to improve this experience in the long run and eventually have an officially supported set of vis APIs that change in a predictable manner.

So during 7.x, as we prepare Kibana's core plugins for this new platform, we are taking the opportunity to audit all of our existing visualization APIs and start thinking about how/if they need to change in the future. This is why we aren't currently publishing a lot of information about developing visualization plugins: we expect this process to look a little different in 8.0 and beyond, and we want to be able to guide people toward the best long-term solutions as soon as we have aligned on what they will look like.

In the meantime, nothing significant is changing from the currently documented approach, but there will be some updates during v7. The best way to follow along during will still be to track the Developing Visualizations documentation, as well as the releases section in our blog, where we try to publish information about any changes that may affect vis plugin development. Our aim is to keep our documentation up-to-date during this migration, so if you notice any discrepancies, please don't hesitate to open a PR with a correction or let us know!

Thanks for the details, I really appreciate it.

I have opened another discussion to focus more on creating a custom request handler here. If you think there is anything else you can help with in regards to that, please do. Otherwise thanks a lot for all your help :slight_smile:

This topic was automatically closed 28 days after the last reply. New replies are no longer allowed.