Hi,
I've setup metricbeat not to directly write into elasticsearch, but I configured it to write to a logfile.
I like to get the metrics buffered in filesystem for the case that metricbeat or sth in the complete pipeline breaks, so that I don't lose events.
This metricbeat probe logfile I ship via filebeat to redis. Logstash is fetching the entires and processes them by this filter:
input
{
	redis
	{
			data_type => "list"
			db => "0"
			host => "${REDIS_HOST}"
			key => "metricbeat"
			port => "${REDIS_PORT}"
	}
}

filter
{
	json
	{
			id => "json"
			source => "message"
	}

	# delete message if no _jsonparsefailure
	if ("_jsonparsefailure" not in [tags])
	{
			mutate
			{
					remove_field => ['message']
			}
	}
}

output
{
	elasticsearch
	{
			hosts => ["${ES_HOST}:${ES_PORT}"]
			#index => "%{[logType]}-%{+YYYY.MM.dd}"
			index => "%{[logType]}-%{+YYYY.ww}"
	}
}
In my eyes the result looks good in discover module:

But if I go for the infrastructure button, then no results are shown:
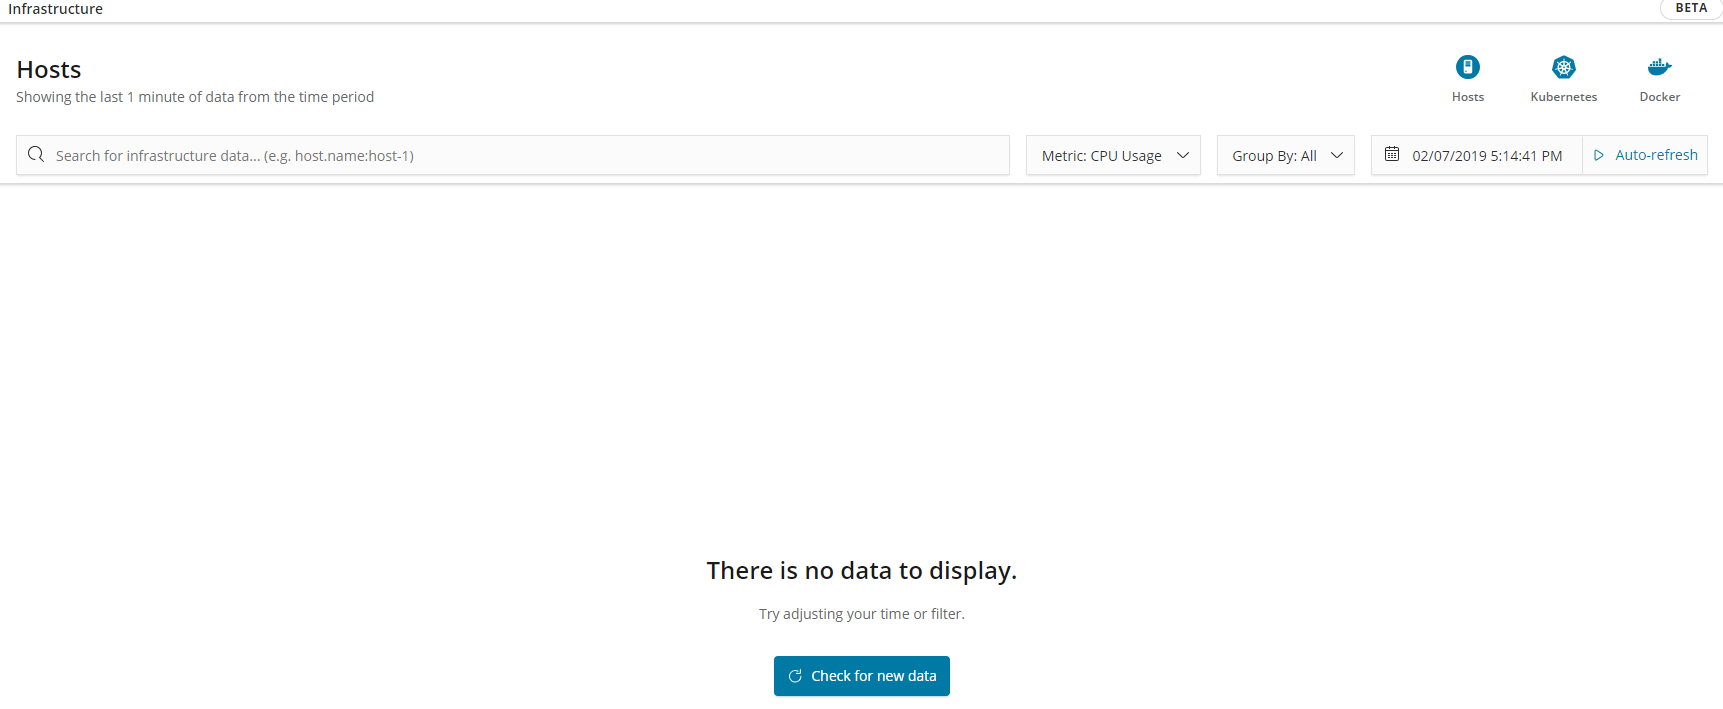
Could you help me and point at the error what I missed?
Yes, I removed the message field after successful parsing, but the json output of metricbeat log does not contain a field called message. So I doubt it has sth. to do with this.
I did not create the metricbeat dashboards and visualizations which are shipped metricbeat. Is that the problem?
Next week i have to present kibana to some people and I would like to get this module running until then.
Thanks a lot, Andreas