How to integrate AWS Lambda with plugin Elastic

I am using functions beat to get logs from aws lambda (cloudwatch). But, i know exists an integration ready for AWS Lambda at Browse all integrations in cloud Elastic. I don't find documentation how to use this integration.

I configured aws access key and secret key, but not exist doc for installation in lambda, only Linux, WIndows and others.

What the way installation this integration with AWS Lambda.

Hi @Renato_Souza Welcome to the community ... Perhaps you are looking for this?
(Functionbeat is slowly being deprectated)

1 Like

Thanks for the tip and sorry for the delay in responding. I did the configuration. But I missed more details on the elastic cloud side, I would have some additional material, I didn't find anything regarding this integration. My VPC Flow logs don't appear on the dashboard, there are no more errors, how can I confirm that I've configured it correctly?

Thank you for help.

Hi @Renato_Souza Unless you show us in detail what all the steps you took and supply sanitized configurations and show us results we won't really be able to help.

But Lets start with a few questions...

What version of the Elastic Stack are you running?

And confirm you are using Elastic Cloud?

Did you install the Assets from the Integration?

Go to Integrations in Kibana and search for AWS. Click the AWS integration to see more details, select Settings and click Install AWS assets to install all the AWS integration assets.

Do you see data the VPC Flow Logs Data in Kibana -> Discover? Yes / No...

If yes can you show us a sample?

Let me know if you see the logs in Discover.. "It Feels" like perhaps the the Flow Logs are not getting parsed...

Okay, I'll prepare everything that was done and attach it to my answer. I currently have this error track in the lambda implemented:

{
    "@timestamp": "2022-06-20T01:07:20.954Z",
    "log.level": "error",
    "message": "exception raised",
    "ecs": {
        "version": "1.6.0"
    },
    "error": {
        "message": "argument of type 'NoneType' is not iterable",
        "stack_trace": "  File \"/var/task/handlers/aws/utils.py\", line 84, in wrapper\n    return func(lambda_event, lambda_context)\n  File \"/var/task/handlers/aws/handler.py\", line 348, in lambda_handler\n    composite_shipper = get_shipper_from_input(\n  File \"/var/task/handlers/aws/utils.py\", line 166, in get_shipper_from_input\n    shipper: ElasticsearchShipper = ShipperFactory.create_from_output(\n  File \"/var/task/shippers/factory.py\", line 35, in create_from_output\n    return ShipperFactory.create(\n  File \"/var/task/shippers/factory.py\", line 67, in create\n    return output_builder(**kwargs)\n  File \"/var/task/shippers/es.py\", line 70, in __init__\n    self._es_client = self._elasticsearch_client(**es_client_kwargs)\n  File \"/var/task/shippers/es.py\", line 93, in _elasticsearch_client\n    return Elasticsearch(**es_client_kwargs)\n  File \"/var/task/elasticsearch/client/__init__.py\", line 205, in __init__\n    self.transport = transport_class(_normalize_hosts(hosts), **kwargs)\n  File \"/var/task/elasticsearch/transport.py\", line 178, in __init__\n    self.set_connections(hosts)\n  File \"/var/task/elasticsearch/transport.py\", line 267, in set_connections\n    connections = list(zip(connections, hosts))\n  File \"/var/task/elasticsearch/transport.py\", line 263, in _create_connection\n    return self.connection_class(**kwargs)\n  File \"/var/task/elasticsearch/connection/http_urllib3.py\", line 130, in __init__\n    super(Urllib3HttpConnection, self).__init__(\n  File \"/var/task/elasticsearch/connection/base.py\", line 143, in __init__\n    if \":\" in host:  # IPv6\n",
        "type": "TypeError"
    },
    "log": {
        "logger": "root",
        "origin": {
            "file": {
                "line": 109,
                "name": "utils.py"
            },
            "function": "wrapper"
        },
        "original": "exception raised"
    },
    "process": {
        "name": "MainProcess",
        "pid": 9,
        "thread": {
            "id": 1402526234234,
            "name": "MainThread"
        }
    }
}

Oh I thought you said you had no more errors :slight_smile: I pinged a couple experts ... Perhaps after you post your sanitized configs they may be able to help

I think the experts are going to take a look but I think I see one issue

In the sarconfig.yaml

You have left the elasticsearch_url in

and then the first error line says it is using it... perhaps remove elasticsearch_url and the username and password since you are using cloud_id and api_key

1 Like

You're right, yesterday at dawn I came across this and I commented out these fields, it started to recover the data successfully. But the VPC dashboard doesn't load the data, I'm having to adjust the graph item by item. For me to retrieve AWS and ECS Fargate lambda logs, do you have any material to recommend?

Thank you for help.

hello @Renato_Souza

as @stephenb said, you'd need to share you configuration file, after sanitising sensible data.

from the error you shared it seems that either you didn't set an hosts param or the yaml of the config file is invalid

Hi @Andrea_Spacca.

According to the previous message I managed to succeed. The problem was the sarconfig.yaml which was uncommented in the username and password.

For me to retrieve AWS and ECS Fargate lambda logs, do you have any material to recommend?

glad to know: I've realised I didn't refresh the page with the latest comments before sending my reply

regarding forwarding Lambda and Fargate logs, they both have CloudWatch Logs as primary log destination, so you can just use the cloudwatch-logs input for both

Oh ok. Would this config? I can add multiple IDs in the same block like this:

Or I would have to add several blocks as per demand, like this:

Anyway, i attemp here.

Thank you for help.

the second: one single ID per input

1 Like

After adding my log groups to sarconfig.yaml, just upload it to s3 and wait for the lambda to process? Did he subscribe to log_group?

Ah, can the index be the same (es_datastream_name)?

@Andrea_Spacca @stephenb

the index can be the same as long as the mapping is relevant for both types of long content

once you updated the config you have to update the lambda to set the new cloud watch logs as trigger, please follow the documentation at elastic-serverless-forwarder/README-AWS.md at lambda-v1.1.1 · elastic/elastic-serverless-forwarder · GitHub

Hi @Andrea_Spacca.

I didn't understand what needs to be done in this step, can you help me?

I configured my sarconfig.yaml like this:

 - type: "cloudwatch-logs"
    id: "arn:aws:logs:us-east-1:*******:log-group:/aws/lambda/******-dev-simulation-range"
    outputs:
      - type: "elasticsearch"
        args:
          # either elasticsearch_url or cloud_id, elasticsearch_url takes precedence
          #elasticsearch_url: "http(s)://domain.tld:port"
          cloud_id: "AWS_C**************************************DFkOTY3Yw=="
          # either api_key or username/password, api_key takes precedence
          api_key: "**********************************"
          #username: "username"
          #password: "password"
          es_datastream_name: "test-no-range"
          batch_max_actions: 500
          batch_max_bytes: 10485760

I provided the permissions for the lambda to access cloudwatch:

{
    "Version": "2012-10-17",
    "Statement": [
        {
            "Sid": "VisualEditor0",
            "Effect": "Allow",
            "Action": [
                "logs:ListTagsLogGroup",
                "logs:DescribeLogGroups",
                "logs:DescribeLogStreams",
                "logs:DescribeSubscriptionFilters",
                "logs:StartQuery",
                "logs:GetLogEvents",
                "logs:DescribeMetricFilters",
                "logs:FilterLogEvents",
                "logs:GetLogGroupFields"
            ],
            "Resource": [
                "arn:aws:logs:us-east-1:******:log-group:/aws/lambda/dev-simulation-range",
                "arn:aws:logs:us-east-1:******:log-group:/aws/lambda/dev-simulation-range:*"
            ]
        },
        {
            "Sid": "VisualEditor1",
            "Effect": "Allow",
            "Action": [
                "logs:DescribeQueries",
                "logs:DescribeExportTasks",
                "logs:GetLogRecord",
                "logs:GetQueryResults",
                "logs:StopQuery",
                "logs:TestMetricFilter",
                "logs:DescribeQueryDefinitions",
                "logs:DescribeResourcePolicies",
                "logs:GetLogDelivery",
                "logs:DescribeDestinations",
                "logs:ListLogDeliveries"
            ],
            "Resource": "*"
        }
    ]
}

Trigger added:

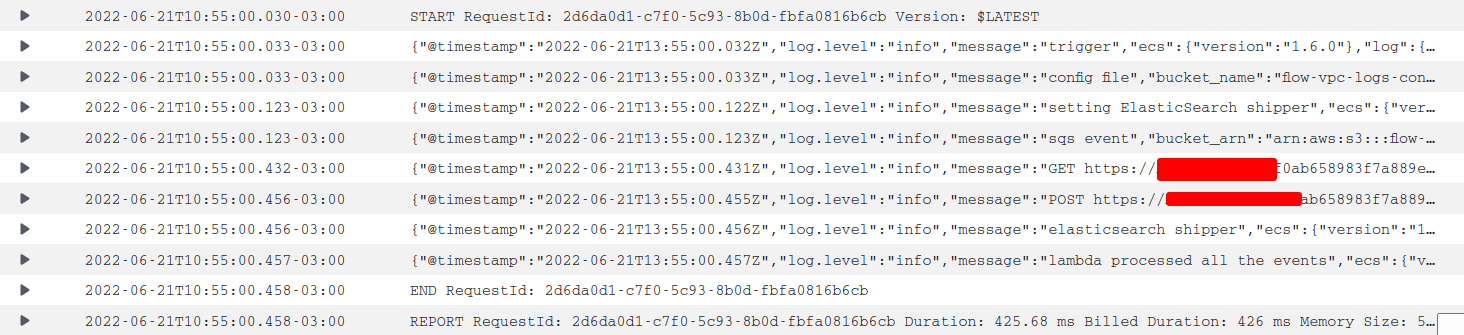
I don't see anything different in the lambda log:

No errors:

I take the opportunity to ask if the functionbeat works for me, why should I switch to sar? Sar is very complex to configure. With SAR metrics like: Lambda Top Invoked Functions [Metrics AWS
work? Because with functionbeat no, I have to do everything manually and I don't even know if I can have this level of data, since functionbeat only retrieves logs, but it seems that sar also only retrieves logs. Help me, documentation is very complex for newbies

indeed is quite the contrary: you just have to fill the comma separated list of ARNs for your inputs and the SAR template will take care of creating everything for you

the last messages says that "lambda processed all events", but they are coming from the s3-sqs as you can see if you expand the second line in the log and look at the value of the type field in the json

so either the cloudwatch log has not new content since you added it as trigger of the forwarder lambda, or you should look for other logs

you can run the following query on log insight in order to see if any cloudwatch-logs input triggered the lambda:

filter message == "trigger"
| fields @timestamp, type
| sort @timestamp desc

please. feel free to report that part of the documentation that's not clear, we really want to improve it :slight_smile:

the part about permissions etc just explains what will be created, but you don't have to do it manually

I'd suggest you start from scratch creating a new function from SAR and just fill the fields in the console as shown in the image I've attached.

I'm looking at tutorial, it asks me some things about permissions and also creating a role, I got confused. I don't need to follow these steps, just create the function?

I manually added logs to keep track, but to no avail.

I will do the process just adding the lambda SAR and the configuration bucket, correct? I don't need to worry about permissions and etc.

I checked and is necessary create the permissions, this steps are necessary.

the tutorial is now outdated, I'm sorry.
I will report internally about the confusion, thanks

you can reference the documentation on AWS SAR, that is always aligned to current release: Application Search - AWS Serverless Application Repository

1 Like

Thanks for the return. I've analyzed the document. One question, I can put the arn data from my cloudwatch logs at the time of deploying the lambda and also in the file sarconfig.yaml, correct? I was confused if I should put in both or I can set where I can enter this information.

Put my cloudwatch logs here?

Or put my cloudwatch here?