How to integrate syslog input plugin

Hello Rios

I have made the changes in LS conf as below. But still no luck, as I am unable to see the latest logs in the Kibana GUI for LS.

input {
  tcp {
    port => 5146
    type => syslog
  }
  udp {
    port => 5146
    type => syslog
  }
}

filter {
  if [type] == "syslog" {
    grok {
      match => { "message" => "%{SYSLOGTIMESTAMP:syslog_timestamp} %{SYSLOGHOST:syslog_hostname} %{DATA:syslog_program}(?:\[%{POSINT:syslog_pid}\])?: %{GREEDYDATA:syslog_message}" }
      add_field => [ "received_at", "%{@timestamp}" ]
      add_field => [ "received_from", "%{host}" ]
    }
    date {
      match => [ "syslog_timestamp", "MMM  d HH:mm:ss", "MMM dd HH:mm:ss" ]
    }
  }
}

output {
  elasticsearch {
    hosts => ["http://localhost:9200"]
    index => "logstash-202312_%{+YYYYMM}"
    user => "elastic"
    password => "changeme"
  }
  stdout { codec => rubydebug }
}

Where in your dashboard or Discovery? The syslog OOB dashboard is from FB. You must have the same fields as there and write to filebeat index.

According to your last settings: index => "logstash-202312_%{+YYYYMM}", data should be in this index: logstash-202312_202312

Hello,

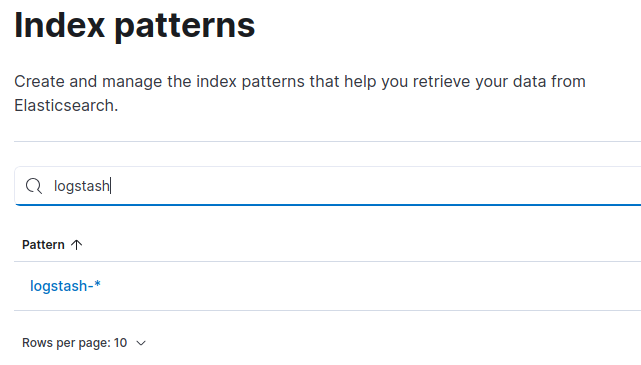
Its not shows in Discovery. Also the index pattern for LS what I see from the Kibana GUI is as per the ss below. And my LS config is also attached below for the reference. I am not able to continue on how to make this working. Please suggest.

input {
  tcp {
    port => 5144
    type => syslog
  }
  udp {
    port => 5144
    type => syslog
  }
}

filter {
  if [type] == "syslog" {
    grok {
      match => { "message" => "%{SYSLOGTIMESTAMP:syslog_timestamp} %{SYSLOGHOST:syslog_hostname} %{DATA:syslog_program}(?:\[%{POSINT:syslog_pid}\])?: %{GREEDYDATA:syslog_message}" }
      add_field => [ "received_at", "%{@timestamp}" ]
      add_field => [ "received_from", "%{host}" ]
    }
    date {
      match => [ "syslog_timestamp", "MMM  d HH:mm:ss", "MMM dd HH:mm:ss" ]
    }
  }
}

output {
  elasticsearch {
    hosts => ["http://localhost:9200"]
    index => "logstash-*_%{+YYYYMM}"
    user => "elastic"
    password => "changeme"
  }

![image|641x365](upload://eKFzu0XfatkUUUB3o1xJ5rkm1TW.png)

image

Hello

Please can someone assist on the issues reported above in my posts as I am stuck at the moment and unable to proceed to make this work.

  1. Syslog input plugin using Logstash is installed and can run after loading the new configuration file created e.g. logstash-sys.conf
[INFO ] 2023-12-15 12:58:53.372 [[main]<udp] udp - Starting UDP listener {:address=>"0.0.0.0:5144"}
[INFO ] 2023-12-15 12:58:53.413 [[main]<udp] udp - UDP listener started {:address=>"0.0.0.0:5144", :receive_buffer_bytes=>"106496", :queue_size=>"200
  1. Currently I am able to see the sample data logs on the Kibana GUI after selecting logstash instead of filebeat but the sample logs data I am pushing is by using telnet to ELK server

  1. What config changes are required so that the client server can keep on sending the syslog data automatically to the Kibana GUI

Most importantly why we need the syslog input plugin (using logstash) when we can have this using filebeat

Thanks,

Hello,

Can someone please assist on my queries in above post dated 15th Dec-23?

Thanks,
Ravi

Hello,

What is your current issue? It is not clear.

Once your Logstash input is listening, you need to configure your clients to send log to the port you choose.

What do you mean with that? It is not clear.

Leandro, many things are unclear here.
For now we have LS started on the ports 5144, both TCP and UDP.

  1. We don't know is it the source configured to send data to LS on the 5144 port. If is not set, Ravi you have to set.
  2. If a device or OS is sending data to 5144 port, make sure:
  • the communication path is opened - firewall rules from client to LS
    ufw allow 9200 - this allow only the communication to ES, if FW is still active, add also port 5144. Since we don't know which port with source send data and which the protocol is used TCP or UDP. Pls check on the client syslog side
  • validate with tcpdump on LS host
  1. When tcpdump show data, LS will also, because there is no restrictions in input area.
    Start LS in the cmd line mode, and stdout { codec => rubydebug } should show you data. You can even try telnet localhost 5144 send any data, the out will show data like this:
{
       "service" => {
        "type" => "system"
    },
    "@timestamp" => 2023-12-19T00:08:02.095933400Z,
          "tags" => [
        [0] "_grokparsefailure_sysloginput"
    ],
          "host" => {
        "ip" => "0:0:0:0:0:0:0:1"
    },
       "message" => "test dump\r\n",
      "@version" => "1",
         "event" => {
        "original" => "test dump\r\n"
    },
           "log" => {
        "syslog" => {
            "facility" => {
                "code" => 0,
                "name" => "kernel"
            },
            "priority" => 0,
            "severity" => {
                "code" => 0,
                "name" => "Emergency"
            }
        }
    }
}
  1. If you see data on the cmd output, you will also see on your logstash index with the code you already put.
    elasticsearch {
    hosts => ["http://localhost:9200"]
    index => "logstash-*_%{+YYYYMM}"
    user => "elastic"
    }

I would also comment IF, it's useless for your case:

filter {
 # if [type] == "syslog" {
    grok {
      match => { "message" => "%{SYSLOGTIMESTAMP:syslog_timestamp} %{SYSLOGHOST:syslog_hostname} %{DATA:syslog_program}(?:\[%{POSINT:syslog_pid}\])?: %{GREEDYDATA:syslog_message}" }
      add_field => [ "received_at", "%{@timestamp}" ]
      add_field => [ "received_from", "%{host}" ]
    }
    date {
      match => [ "syslog_timestamp", "MMM  d HH:mm:ss", "MMM dd HH:mm:ss" ]
    }
  # }
}

Hello Rios and Leandro

Thanks for your inputs. I will check and update here.

Thanks,

Hello Rios

I was able to proceed to some extent and was able to see the syslog being pushed from the client server to the LS running on main ELK and could see under the Kibana GUI under the "Discovery > LS" from the drop down option.

~# lsof -i | grep 514
java       395        logstash  133u  IPv6  20870      0t0  TCP *:5144 (LISTEN)
java       395        logstash  136u  IPv4  20885      0t0  UDP *:5144  

However, I am facing some challenges where the disk space is getting fully utilized within short interval of time and the kibana service getting killed e.g. details below.

× kibana.service - Kibana
     Loaded: loaded (/etc/systemd/system/kibana.service; enabled; vendor preset: enabled)
     Active: failed (Result: exit-code) since Thu 2023-12-21 14:20:05 UTC; 9min ago
       Docs: https://www.elastic.co
    Process: 1267 ExecStart=/usr/share/kibana/bin/kibana --logging.dest=/var/log/kibana/kibana.log --pid.file=/run/kibana/kibana.pid --deprecation.sk>
   Main PID: 1267 (code=exited, status=1/FAILURE)
        CPU: 13.865s

Dec 21 14:20:02 ELK-new systemd[1]: kibana.service: Consumed 13.865s CPU time.
Dec 21 14:20:05 ELK-new systemd[1]: kibana.service: Scheduled restart job, restart counter is at 2.
Dec 21 14:20:05 ELK-new systemd[1]: Stopped Kibana.
Dec 21 14:20:05 ELK-new systemd[1]: kibana.service: Consumed 13.865s CPU time.
Dec 21 14:20:05 ELK-new systemd[1]: kibana.service: Start request repeated too quickly.
Dec 21 14:20:05 ELK-new systemd[1]: kibana.service: Failed with result 'exit-code'.
Dec 21 14:20:05 ELK-new systemd[1]: Failed to start Kibana.

Also on the Kibana a message pops as below

We encountered an error retrieving search results

Show error message

Error message as below

index [.async-search] blocked by: [TOO_MANY_REQUESTS/12/disk usage exceeded flood-stage watermark, index has read-only-allow-delete block];

Please suggest if I am missing anything.

Thanks,
Ravi

Check your disk space. You must have 15% free disk space where is ES.

Hello Rios,

Thanks for the reply. Yes, its the disk space issue which is creating a problem.

# df -kh
Filesystem      Size  Used Avail Use% Mounted on
/dev/root       7.6G  6.9G  704M  91% /

I may also have done wrong unknowingly that I added the below entry at the client server because of this reason the messages are being flooded at the main ELK server where LS is also running.

/etc/rsyslog.d/50-default.conf

*.*                         @@<ELK IP>:10514

You can use the command for 10 largest dirs:
du -h / | sort -rh | head -10

/etc/rsyslog.d/50-default.conf

Is this location where you put LS conf file? If you want Linux syslog forwarding to LS, you have to change /etc/rsyslog.conf to something like this:

*.* action(type="omfwd" target="yourip" port="5144" protocol="tcp")

It's not problem if you have LS, ES and KIB and a single server util you have enough resources.

Hello Rios,

I tried with the above config at the client server in /etc/rsyslog.d/50-default.conf as per below but its for udp.

*.* action(type="omfwd" target="172.31.40.45" port="5144" protocol="udp")
# First some standard log files.  Log by facility.
#

Issues:

  1. Again same issue as the main ELK where LS is running is flooded with the messages and server running out of space. I have created the log rotation for the syslog but still the issue persists and the existing syslog at the ELK server gets filled up very fast.
# ls -lrth syslog*
-rw-r----- 1 syslog adm  13M Dec 22 04:10 syslog.1.gz
-rw-r--r-- 1 syslog adm 315M Dec 22 04:57 syslog
df -kh
Filesystem      Size  Used Avail Use% Mounted on
/dev/root       7.6G  7.3G  356M  96% /
tmpfs           2.0G     0  2.0G   0% /dev/shm
tmpfs           781M  876K  781M   1% /run
tmpfs           5.0M     0  5.0M   0% /run/lock
/dev/xvda15     105M  6.1M   99M   6% /boot/efi
tmpfs           391M  4.0K  391M   1% /run/user/1000

Clean your disk space, check where is the largest dir
du -h / | sort -rh | head -10

This issue is unrelated to Elasticsearch, you have a disk space issue.

Your entire disk have just 7.6 GB this may be too low for what you are trying to use Elasticsearch, you will need to increase your disk size or add a new disk exclusively to the Elasticsearch data.

Hello Leondro

I have changed to the server where the disk space is not an issue.

/dev/sda         79G   53G   22G  71% /

Now, I see as things are progressing to some extent. But I could see services like kibana and elasticsearch.service are getting killed often. More details below.

[INFO ] 2023-12-25 11:17:17.456 [[main]-pipeline-manager] javapipeline - Pipeline Java execution initialization time {"seconds"=>22.94}
[INFO ] 2023-12-25 11:17:22.744 [[main]-pipeline-manager] javapipeline - Pipeline started {"pipeline.id"=>"main"}
[INFO ] 2023-12-25 11:17:23.251 [[main]<tcp] tcp - Starting tcp input listener {:address=>"0.0.0.0:5144", :ssl_enable=>false}
[WARN ] 2023-12-25 11:17:24.750 [[main]<udp] plain - Relying on default value of `pipeline.ecs_compatibility`, which may change in a future major release of Logstash. To avoid unexpected changes when upgrading Logstash, please explicitly declare your desired ECS Compatibility mode.
[WARN ] 2023-12-25 11:17:25.384 [[main]<udp] plain - Relying on default value of `pipeline.ecs_compatibility`, which may change in a future major release of Logstash. To avoid unexpected changes when upgrading Logstash, please explicitly declare your desired ECS Compatibility mode.
[INFO ] 2023-12-25 11:17:26.541 [Agent thread] agent - Pipelines running {:count=>1, :running_pipelines=>[:main], :non_running_pipelines=>[]}
[INFO ] 2023-12-25 11:17:26.648 [[main]<udp] udp - Starting UDP listener {:address=>"0.0.0.0:5144"}
[INFO ] 2023-12-25 11:19:51.224 [[main]<udp] udp - UDP listener started {:address=>"0.0.0.0:5144", :receive_buffer_bytes=>"106496", :queue_size=>"2000"}
[ERROR] 2023-12-25 11:25:43.963 [[main]>worker0] elasticsearch - Attempted to send a bulk request but there are no living connections in the pool (perhaps Elasticsearch is unreachable or down?) {:message=>"No Available connections", :exception=>LogStash::Outputs::ElasticSearch::HttpClient::Pool::NoConnectionAvailableError, :will_retry_in_seconds=>64}
[ERROR] 2023-12-25 11:25:43.972 [[main]>worker1] elasticsearch - Attempted to send a bulk request but there are no living connections in the pool (perhaps Elasticsearch is unreachable or down?) {:message=>"No Available connections", :exception=>LogStash::Outputs::ElasticSearch::HttpClient::Pool::NoConnectionAvailableError, :will_retry_in_seconds=>64}
[WARN ] 2023-12-25 11:25:44.477 [Ruby-0-Thread-9: :1] elasticsearch - Restored connection to ES instance {:url=>"http://elastic:xxxxxx@localhost:9200/"}
/var/log/elasticsearch/elasticsearch.log

[2023-12-25T11:19:38,736][WARN ][o.e.t.TransportService   ] [localhost] Received response for a request that has timed out, sent [20.4s/20431ms] ago,
timed out [4.2s/4220ms] ago, action [indices:monitor/stats[n]], node [{localhost}{72G9nkzST9iLSgbdiUtZSQ}{H08vjNkETyCRj764hbtvyg}{localhost}{127.0.0.1
:9300}{cdfhilmrstw}{ml.machine_memory=4102045696, xpack.installed=true, transform.node=true, ml.max_open_jobs=512, ml.max_jvm_size=2147483648}], id [1
30686]
[2023-12-25T11:19:50,614][WARN ][o.e.c.InternalClusterInfoService] [localhost] failed to retrieve shard stats from node [72G9nkzST9iLSgbdiUtZSQ]: [loc
alhost][127.0.0.1:9300][indices:monitor/stats[n]] request_id [130686] timed out after [16211ms]

Also I am seeing that backend server when issuing commands from CLI and Kibana GUI are seen with very slow response.

And sometimes the below error on the GUI.

{"statusCode":503,"error":"Service Unavailable","message":"License is not available."}
# systemctl status elasticsearch.service
× elasticsearch.service - Elasticsearch
     Loaded: loaded (/lib/systemd/system/elasticsearch.service; enabled; vendor preset: enabled)
     Active: failed (Result: signal) since Mon 2023-12-25 11:33:32 UTC; 2min 56s ago
       Docs: https://www.elastic.co
    Process: 1871 ExecStart=/usr/share/elasticsearch/bin/systemd-entrypoint -p ${PID_DIR}/elasticsearch.pid --quiet (code=killed, signal=KILL)
   Main PID: 1871 (code=killed, signal=KILL)
        CPU: 7min 18.650s

Dec 25 11:24:44 localhost systemd[1]: Starting Elasticsearch...
Dec 25 11:25:41 localhost systemd[1]: Started Elasticsearch.
Dec 25 11:33:32 localhost systemd[1]: elasticsearch.service: Main process exited, code=killed, status=9/KILL
Dec 25 11:33:32 localhost systemd[1]: elasticsearch.service: Failed with result 'signal'.
Dec 25 11:33:32 localhost systemd[1]: elasticsearch.service: Unit process 2051 (controller) remains running after unit stopped.
Dec 25 11:33:32 localhost systemd[1]: elasticsearch.service: Consumed 7min 18.645s CPU time.
root@localhost:~# systemctl restart  elasticsearch.service

Could you please suggest further?

Thanks,
Hello Leandro

Also it is observed that the syslog file on the main ELK where LS is running is getting filled at a fast interval even though there is a log rotation.

Please suggest on my query for yesterday and today.

# ls -lrth syslog*
-rw-r----- 1 syslog adm 2.2M Dec  3 00:00 syslog.4.gz
-rw-r----- 1 syslog adm 2.7M Dec 10 00:00 syslog.3.gz
-rw-r----- 1 syslog adm 3.1M Dec 17 00:00 syslog.2.gz
-rw-r----- 1 syslog adm 145M Dec 24 00:00 syslog.1
-rw-r----- 1 syslog adm 4.6G Dec 25 14:08 syslog

Thanks,
Ravi

Have you try to use the throttle plugin? If is suitable for your case.

Hello Rios,

Thanks for getting back. The requirement is syslog input plugin using LS.
Hence, I haven't tried about the throttle plugin.