our elastic is v8.6
3 master, 40x datanode (8core/32GB/2TB) , 2x loadbalancer node
We ingest 100k-900K events/sec by few hundreds of different ingest pipelines, some of them creates small indices but there is about 5-8 high performance pumps.
we are repeatedly facing the performance problem with single node overload.
since v8 there is a huge improvement however this problem still happened on weekly basis
I suspect that problem is caused by high performance pumps + ILM when cluster allocates hi-perf shards on the same host which causes its local overload.
This is the reason why I am looking for more detailed monitoring for troublehooting this problem
Idea is to monitor load of node and breakdown of this load to particular shard.
As result I want to see what type of ingest is causing node overload.
Is there aby best practice?
I plan to use cat/_shards API to periodically get the detail and store it in timeseries
this method will provide shardname, some dynamic load parameters and NODE..
So i will be able to link load of shard to NODE.
But I do not know which parameter is providing current ingest rate in time.
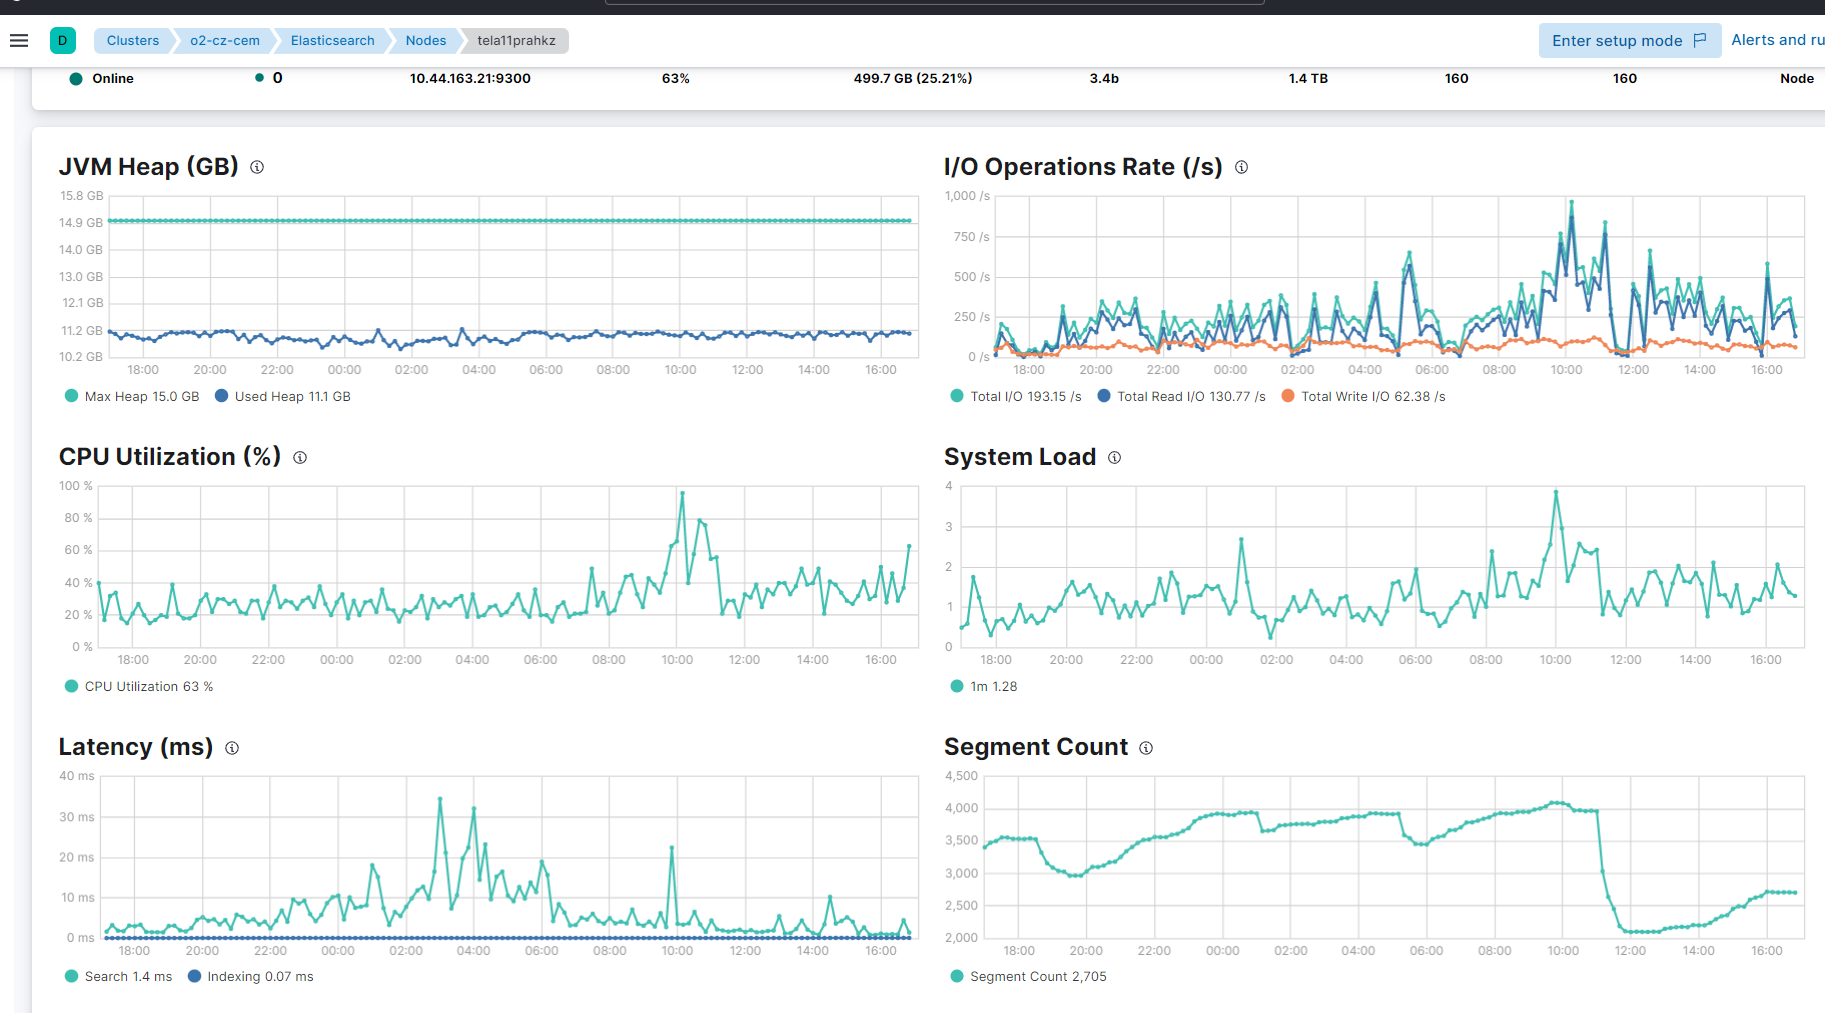
in the picture above is the current problem 100% CPU load of one node
so I want to see breakdown / stack what causes this load.
any idea how to achieve this?
Thank you
How many indices are you actively indexing into? How many of these are getting high volumes? How many primary and replica shards do these indices have?
What type of storage do your nodes have? Local SSDs?
What does disk I/O and iowait look like on the data nodes?
@Christian_Dahlqvist thank you for asking
How many indices are you actively indexing into?
95 Indices + there are about 50 not active
How many of these are getting high volumes?
10 indices
How many primary and replica shards do these indices have?
primary/replica vary depending on performance
for small indices 1/1 for larger we have up to 10/0
| index count |
primary shards |
| 4 |
8 |
| 3 |
10 |
| 93 |
1 |
| 1 |
5 |
| 3 |
2 |
| 6 |
6 |
| 16 |
3 |
What type of storage do your nodes have? Local SSDs?
it is running on VMWare VM, and storage is connected via iSCSI - full SSD
What does disk I/O and iowait look like on the data nodes?
read/write latency on one particular node looks 3ms in average on write
but some nodes are higher on latencies
and for instance tela11 which is on top row now looks from elastic perspective this way
@Christian_Dahlqvist do you know if I can draw a graph from some internal index where I can determine the node load?
If I can get an information detailing how the CPU load on one node breaks down to the specific tasks that this node performs. - Ingestion of index A,B,C. or something else.