Hi,
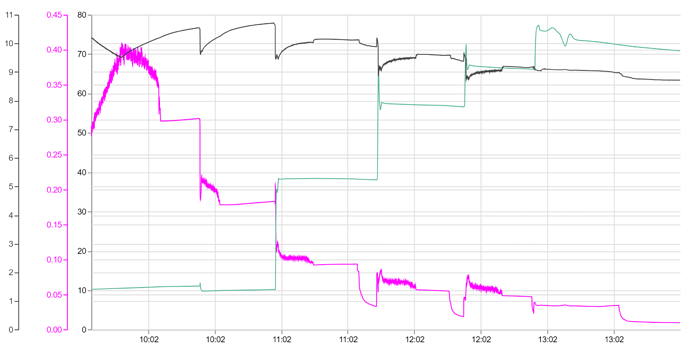
I want to plot my raw time series data. As far as I know this is not possible with normal visualizations. This is why I am currently looking into Vega-Lite. The data structure looks like this:
{
  "_index": "index_new",
  "_type": "index",
  "_id": "ABCD.....",
  "_version": 1,
  "_score": null,
  "_source": {
    "Value1": 56.60521,
    "Value2": 0,
    "Value3": 9.46315,
.
.
.
  },
  "fields": {
    "@timestamp": [
      "20XX-08-31T1X:XX:XX.759Z"
    ],
    "timestamp": [
      "20XX-08-31TXX:XX:XX.759Z"
    ]
  },
  "sort": [
    1267276399749
  ]
}
I can plot this with the following Vega-Lite script:
{
  $schema: "https://vega.github.io/schema/vega-lite/v2.json"
  mark: line
  data: {
    url: {
      %context%: true
      %timefield%: timestamp
      index: index_new
      body: {
        size: 10000, //This is used to plot the raw data, thats why I need Vega
        _source: ["timestamp", "Value1"]
      },
    }
    format: { property: "hits.hits" }
  }
    transform: [
    {
      calculate: "toDate(datum._source['timestamp'])"
      as: "time"
    }
  ]

  encoding: {
    x: {
      field: time
      type: temporal
      axis: { title: "Zeit" }
    }
    y: {
      field: _source.Value1
      type: quantitative
      // Specify the label for this axis
      axis: { title: "Value" }
    }
    color: {
      field: _source.extension
      type: nominal
      legend: { title: 'File type' }
    }
  }
}
Result:
It should look something like this:
My Questions:
- How can I draw different lines on the same diagram?
- How can I change the timescale? I am in europe and don't use AM, PM.
- How can I use different scales on the Y Axis for Value1, Value2 etc.?
I tried it with something like this:
  "mark": "line",
  "encoding": {
    "x": {"field": "Value1", "type": "temporal"},
    "y": {"field": "Value2", "type": "quantitative"},
    "color": {"field": "_source", "type": "nominal"}
  }
}
but it doesn't show anything. Found it here: https://vega.github.io/vega-lite/examples/line_color.html
Can someone help with me with my Vega-Problems.
Thanks,
Defalt


