How to use last value in a custom visualization?

I have been trying to create a custom visualization with vega to display some simple data. In this case, I wanted to display the data from a vehicle where it would show the battery current vs the vehicle speed (I'm starting with something simple just to get a better understanding of how it works)

My code looks like this:

{
  "$schema": "https://vega.github.io/schema/vega-lite/v5.json",
  "title": "Battery Current vs Vehicle Speed",
  "data": {
    "url": {
      "%context%": true,
      "%timefield%": "dateTime",
      "index": "my-index",
      "body": {
        "aggs": {
          "time_buckets": {
            "date_histogram": {
              "field": "dateTime",
              "interval": {"%autointerval%": true},
              "extended_bounds": {
                "min": {"%timefilter%": "min"},
                "max": {"%timefilter%": "max"}
              },
              "min_doc_count": 0
            }
          }
        },
        "size": 0
      }
    },
    "format": {"property": "aggregations.time_buckets.buckets"}
  },

  "repeat": {
    "layer": ["vehicleSpeed", "batteryCurrent"]
  },
  
  "spec": {
    "mark": "line",
    "encoding": {
      "x": {
        "field": "key", 
        "type": "temporal",
        "timeUnit": "hoursminutes",
        "axis":{ title:"Date"}
        },
      "y": {
        "aggregate": "count",
        "field": {"repeat": "layer"},
        "type": "quantitative",
        "title": false
      },
      "color": {"datum": {"repeat": "layer"}, "type": "nominal"},
     
      "tooltip":[{
        "field": "time_buckets.buckets.key_as_string"
        "type": "temporal"
        "title":"Date"
      },{
        "field": "processedData.VMU1.vehicleSpeed"
        "type": "quantitative"
        "title":"Speed"
      },{
        "field": processedData.batteryCurrent
        "type": "quantitative"
        "title":"Battery Current"
      }]
    }
  }
}

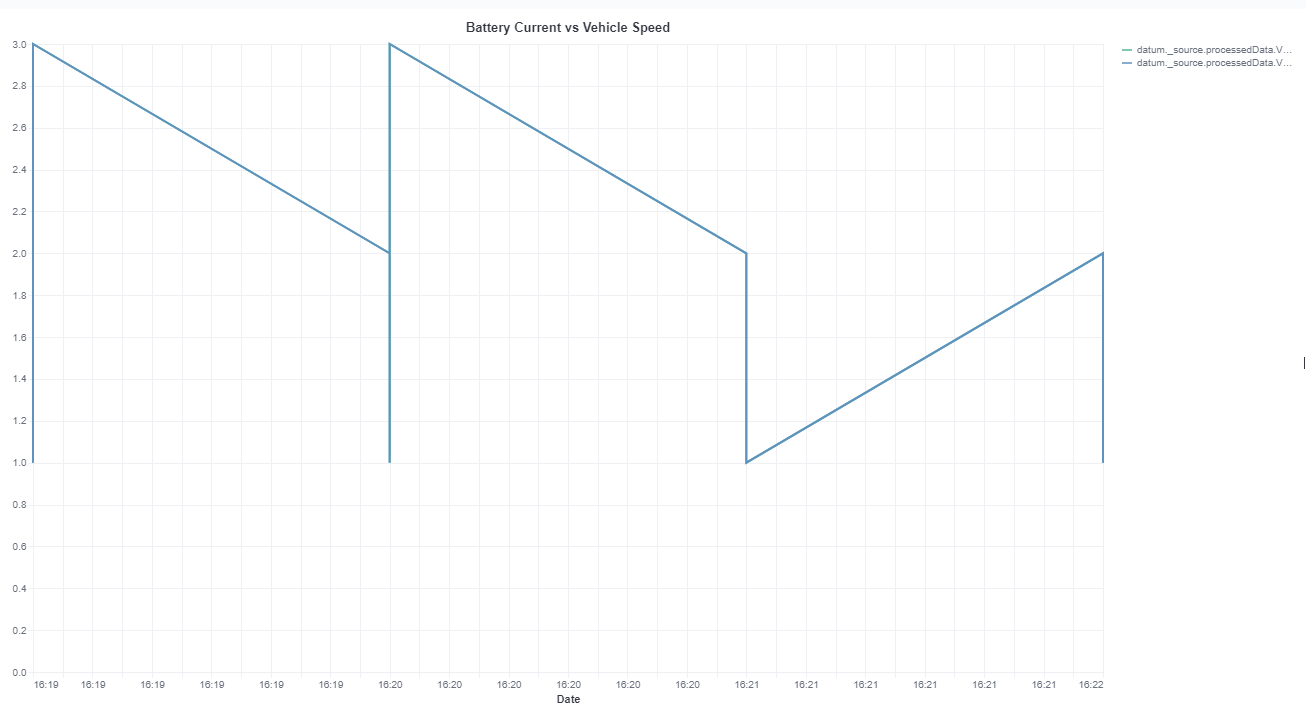
It renders but it doesn't have the correct values, just the two lines crossing the value 2, the Y axis is just going from 0 to 2 instead of 0 to 90 (higher value in the speed).
I know that my Y doesn't have the correct aggregation but when I change it for something else I have the error "Infinite extent for field" for both my fields, the speed and the battery current.

Any idea what could be the issue and how I can fix it?

@nyuriks cc .

hi @Joao_Silva , please follow How to submit Kibana Vega question · GitHub -- it will help with actually seeing the result you are getting. Thanks!

Hi @nyuriks I have followed your steps to pull out the data, let me just give you my current code for the visualization and my results.

(Since I'm not editing the data from the file I'll just "hide" my index)

{
  "$schema": "https://vega.github.io/schema/vega-lite/v5.json",
  "title": "Battery Current vs Vehicle Speed",
  "data": {
    "url": {
      "%context%": true,
      "%timefield%": "dateTimeReceived",
      "index": "my-index",
      "body": {
        "aggs": {
          "time_buckets": {
            "date_histogram": {
              "field": "dateTimeReceived",
              "interval": {"%autointerval%": true},
              "extended_bounds": {
                "min": {"%timefilter%": "min"},
                "max": {"%timefilter%": "max"}
              },
              "min_doc_count": 0
            }
          }
        },
        "size": 1000
      }
    },
    "format": {"property": "hits.hits"}
  },

 
  "repeat": {
    "layer": ["datum._source.processedData.VMU1.vehicleSpeed", "datum._source.processedData.VMU1.batteryCurrent"]
  },
  
  "spec": {
  "scales": [
    {
      "name": "yscale",
      "type": "linear",
      "zero": true,
      "domain": {
        "data": "aggregations.hits.hits", "field": {"repeat": "layer"}
      },
      "range": "height"
    }
  ],
  "axes": [
    {"scale": "yscale", "orient": "left"}
  ],
    "mark": "line",
    transform: [{
      calculate: "toDate(datum._source.dateTimeReceived)",
      as: "time"
    },
   
    ]
    "encoding": {
      "x": {
        "field": "time", 
        "type": "temporal",
        "timeUnit": "hoursminutes",
        "axis":{ title:"Date"}
        },
      "y": {
        "aggregate": "count",
        "field": {"repeat": "layer"},
        "type": "quantitative",
        "title": false
      },
      "color": {"datum": {"repeat": "layer"}, "type": "nominal"},
     
      "tooltip":[{
        "field": "time"
        "type": "temporal"
        "title":"Date"
      },{
        "field": "datum._source.processedData.VMU1.vehicleSpeed"
        "type": "quantitative"
        "title":"Speed"
      },{
        "field": "processedData.VMU1.batteryCurrent"
        "type": "quantitative"
        "title":"Battery Current"
      }]
    }
  }
}

And the result I'm getting now is this:

Which isn't what I expected since I have speed values over 28.

Since I couldn't upload a file with the data I copied it to pastebin.

Thank you in advance for your help and thank you @rashmi for getting this to Yuri's attention

This topic was automatically closed 28 days after the last reply. New replies are no longer allowed.