I can't get my data table to build correctly

I want to build a data table that would look similar to this:

Tag Name                        Tag Group                        Description
Tag1                                  A_Tags                              This is the description for Tag1
Tag2                                  A_Tags                              This is the description for Tag2
Tag3                                  B_Tags                              This is the description for Tag3

I can get Tag Name and Tag Group to show, but when I add a sub-bucket for the description - I get a random number of them (probably based on something in the description field that is not apparent). Description is a keyword field because if it isn't then I can't even find it in the dropdowns, but I am theorizing that it is doing some weird search on the keyword aspect of it - but really I have no idea.

Here is a set of the doc that I am pulling the info from. TGD is a nested field in the document, but I can find everything, so it's not a nesting issue I would think

"TGD": {
            "name": "theotherplace.com",
            "sig_num": "197646612",
            "processed": 1,
            
            "tag_name": "Able.Tag1",
            "public_tag_name": "Tag1",
            "tag_class": "tag1_family",
            "tag_group": "A_Tags",
            "confidence_level": 70,
            "sample_date": "2018-05-15T03:14:05",
            "tag_description": "This is the description for Tag1",
            "updated_at": "2018-05-19T11:54:04.548351"
          }

Any help or ideas are greatly appreciated.
Adding visualization (which maybe I built wrong as well). Still learnin'


{
  "title": "Dashboard - Tag Description and Group",
  "type": "table",
  "params": {
    "perPage": 50,
    "showPartialRows": false,
    "showMeticsAtAllLevels": false,
    "sort": {
      "columnIndex": null,
      "direction": null
    },
    "showTotal": false,
    "totalFunc": "sum"
  },
  "aggs": [
    {
      "id": "1",
      "enabled": true,
      "type": "count",
      "schema": "metric",
      "params": {}
    },
    {
      "id": "2",
      "enabled": true,
      "type": "terms",
      "schema": "bucket",
      "params": {
        "field": "TGD.public_tag_name.keyword",
        "otherBucket": false,
        "otherBucketLabel": "Other",
        "missingBucket": false,
        "missingBucketLabel": "Missing",
        "size": 50,
        "order": "desc",
        "orderBy": "1",
        "customLabel": "Tag Name"
      }
    },
    {
      "id": "3",
      "enabled": true,
      "type": "terms",
      "schema": "bucket",
      "params": {
        "field": "TGD.tag_description.keyword",
        "otherBucket": false,
        "otherBucketLabel": "Other",
        "missingBucket": false,
        "missingBucketLabel": "Missing",
        "exclude": "Low Priority Tags",
        "size": 50,
        "order": "desc",
        "orderBy": "1",
        "customLabel": "Description"
      }
    },
    {
      "id": "4",
      "enabled": true,
      "type": "terms",
      "schema": "bucket",
      "params": {
        "field": "TGD.tag_group.keyword",
        "otherBucket": false,
        "otherBucketLabel": "Other",
        "missingBucket": false,
        "missingBucketLabel": "Missing",
        "size": 50,
        "order": "desc",
        "orderBy": "1",
        "customLabel": "Tag Group"
      }
    }
  ]
}

Hey @sdndude, the Data Table visualization (and all Visualizations in Visualize for that matter) operate off of Elasticsearch aggregations. If you have a single document for each of the tags in Elasticsearch, I'd recommend using the Discover application to create a "Saved Search" which you can then embed in a Dashboard, as these aren't based on aggregations and give you a single "row" per document in Elasticsearch.

Thank you @Brandon_Kobel It works!!!

However, is there any way to specify that I only show 1 row for each Tag Name? For example, if I have thousands of documents that have been tagged with "Tag1" is there a way to only show 1 line of that in the data table? I am trying to use it so that if a user filters on that tag (by clicking on it in a Tag cloud as an example) they would be able to see 1 line with the tag description and group assigned to it).

Again, thank you very much as you got me over the big hurdle. Now its just a nice to have.

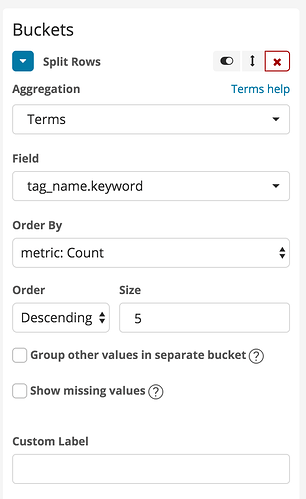
@sdndude if you create a Data Table Visualization with a "Terms" aggregation on the "tag_name", similar to the below, you will only get one row per "tag_name":

If the tag description is the same for all entries with the same "tag_name" you can add a second terms aggregation and each will only create one row:

If you get multiple rows per tag when adding the description, there are likely some small differences that are making these appear as different "tags"

This topic was automatically closed 28 days after the last reply. New replies are no longer allowed.