I'm getting into ELK stack and now I can't figure out how to get and visualize in Kibana metrics of CPU load (in any form, but I suppose the best choice is system.cpu.total.pct ) from my metricbeats. I can do this for memory usage, so I'm kinda getting the idea and the connections beat => ES => Kibana is OK. From what I can see those cpu metrics are not even sent by metricbeat.
Here is my current configuration of metricbeat's system module that I've done basing on the official documentation and issues found on StackOverflow etc. :
  4 - module: system
  5   period: 10s
  6   metricsets:
  7     - cpu
  8     - load
  9     - memory
 10     - network
 11     - process
 12     - process_summary
 13     - socket_summary
 14     #- entropy
 15     #- core
 16     #- diskio
 17     #- socket
 18     #- service
 19     #- users
 20   process.include_top_n:
 21     by_cpu: 5      # include top 5 processes by CPU
 22     by_memory: 5   # include top 5 processes by memory
 23   # Configure the mount point of the host’s filesystem for use in monitoring a host from within a container
 24   #system.hostfs: "/hostfs"
 25   cpu.metrics:  ["percentages","normalized_percentages"]
 26   #core.metrics: ["percentages"]
What am I doing wrong and where could I find some more good references concerning system monitoring with ELK stack please ?
So when you say you can't get... Did you try a simple Lens?
If you just go to Lens pick metricbeat-* and drag system.cpu.total.pct and system.load.1 into the middle of the graph area? Then you can break down by host.
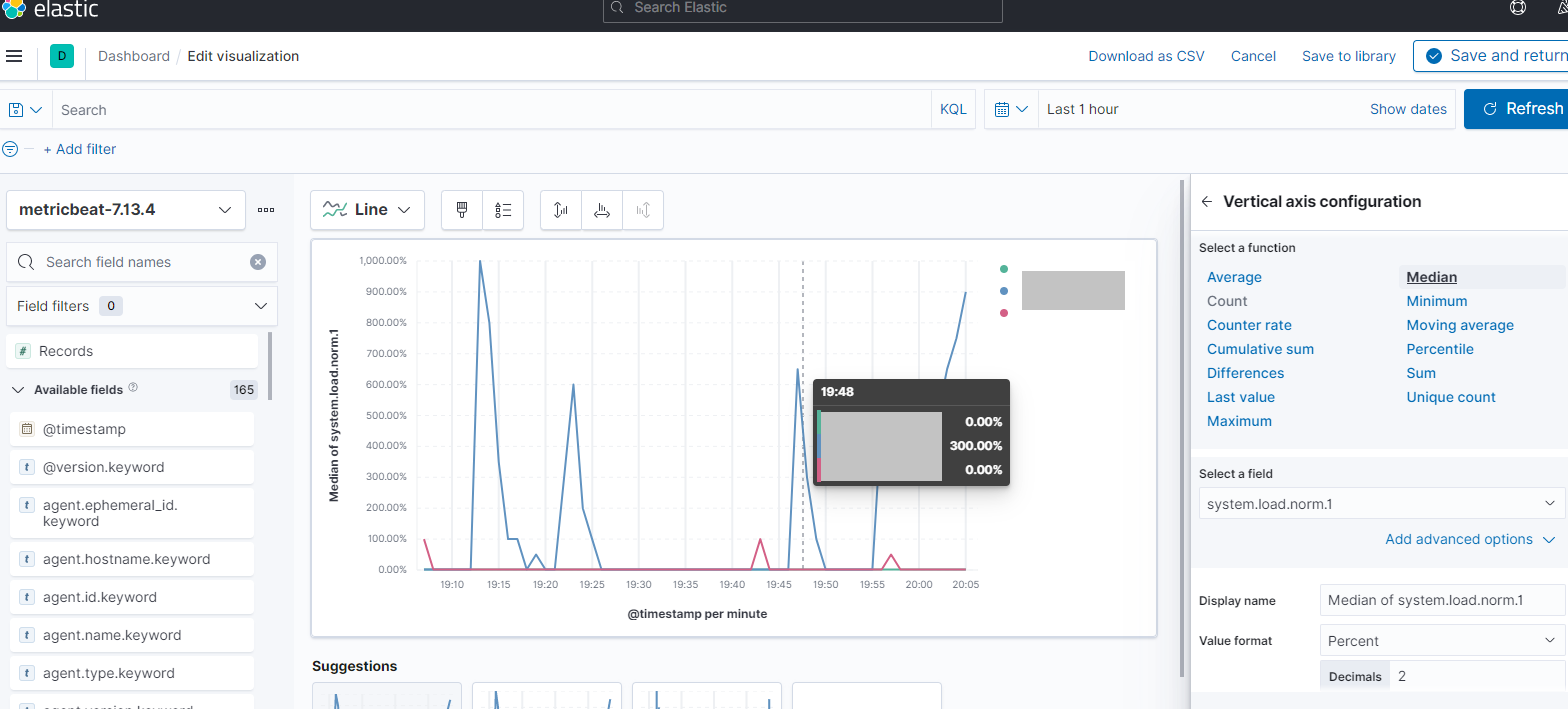
This is actually what I'm trying to do, but for system.cpu.total.pct I have no information obtained from my metricbeats and for system.load.1 it doesn't seem to be accurate and tends to stick to round numbers as 300%, 250% etc (cf. screenshots).
This is why I suppose it is something related to the beat configuration and it must be a really silly thing that I'm missing out, but I can't figure out what it is.
Will appreciate any help
PS. greyed out hostnames as these are internal servers.
First I would not use Median I would use Average sorry I used Median... I wasn't paying attention.
Load is not a Percent it is a Float number so Load of 300% is actually load of 3 .... 2.5, 3, 10 are very normal load numbers... so that looks like it is working.
Try Average / Max on the CPU lets see what is there....
You can also go to discover and see if you see the cpu metricset and see that the values are.
Assuming your config is the same as above it looks good.
What kind of host is this running on? Linux, Docker,...?
Sure, I've tried Average also and I'm aware of different types (Percent, Float etc.). However, the total absence of not round values like 2.41 etc (I have the format set to 2 decimals) seems to be incorrect if we take into account that only values of type 2.00, 2.50 or 3.00 are present.
The thing is that I wanted to use total load or total cpu used normalized per core in the range 1-100% to have a simple look on how heavily my servers are loaded, but I have a lack of entry data.
The main problem is that I don't see any entries from my metricbeat for cpu.used when at the same time I see other metrics so I'm sure the beat is working correctly. When I use Kibana in Discover mode and try to see top 5 values for system.cpu.total.pct - it's 0 in 100%. It's true for almost all metrics except system.process.cpu.total.value (system.process.cpu.total.pct is also 0). (cf. screenshots)
Any permissions issue may be ?
I'm using CentOS 7, all elements of ELK stack installed from tarballs.
# Module: system
# Docs: https://www.elastic.co/guide/en/beats/metricbeat/7.13/metricbeat-module-system.html

- module: system
  period: 10s
  metricsets:
    - cpu
    - load
    - memory
    - network
    - process
    - process_summary
    - socket_summary
    #- entropy
    - core
    #- diskio
    #- socket
    #- service
    #- users
  process.include_top_n:
    by_cpu: 5      # include top 5 processes by CPU
    by_memory: 5   # include top 5 processes by memory
  # Configure the mount point of the host’s filesystem for use in monitoring a host from within a container
  #system.hostfs: "/hostfs"
  cpu.metrics:  [percentages, normalized_percentages]
  #core.metrics: ["percentages"]

- module: system
  period: 1m
  metricsets:
    - filesystem
    - fsstat
  processors:
  - drop_event.when.regexp:
      system.filesystem.mount_point: '^/(sys|cgroup|proc|dev|etc|host|lib|snap)($|/)'

- module: system
  period: 15m
  metricsets:
    - uptime

#- module: system
#  period: 5m
#  metricsets:
#    - raid
#  raid.mount_point: '/'
And metricbeat.yml (the part that concerns modules)
metricbeat.config.modules:
  # Glob pattern for configuration loading
  path: /opt/elastic/metricbeat/modules.d/*.yml

  # Set to true to enable config reloading
  reload.enabled: true

  # Period on which files under path should be checked for changes
  reload.period: 10s
My current user can use top and other commands, I also have root access on the server and created the user myself. I suppose I have no specific restrictions, but I tried to run the beat as root just to check whether it will get any more information about CPU load - nothing. Restarted metricbeat multiple times before and right now and I don't see any errors in logs since the last restart.
What do you mean exactly by "You could try installing the package you will need sudo for that." ?
Yes, I will need sudo for this and I can do this with sudo.
I will probably reinstall it all from scratch just to see if I did anything wrong, but if you have any other clue I would appreciate it
I have reinstalled once again and now I can see all CPU metrics, so for sure there must have been a mistake during configuration. BTW now I've done this omitting logstash as initially there also was a logstash instance and I suppose the initial beat setup went wrong on that stage. And now I have some questions :
is logstash of use at all for metricbeats (or heartbeats) ? for filebeats I do understand the use case, but not for these two;
if I have multiple metricbeats on different machines (let's say 10), I do ./metricbeat setup -e only once when setting up the first beat as it only communicates to ES instance how to interpret my beat data, is that correct ? Suppose the same will be for other beats ?
Thank you a lot for your help once more, I have a better understanding of these things now.
Yes you only need to run setup once per modules....
So you setup 10 hosts with system modules you only need to run setup once
Then you add an 11th system and enable mysql module you should run setup again to make sure all the assets for that module are loaded.
Make Sense
In general Logstash is not of great use for metricbeat (not to say there are no any edge cases) but there is an Architecture pattern using Logstash as a Collect and Forward so that only 1 egress IP is needed to say forward metric from many 100s or 1000s of hosts to Elastic Cloud, we see this in enterprises for example. This way not every host has to have access to the internet.
Filebeat with Logstash can be helpful for parsing custom logs etc which you could also do in Ingest Pipelines.
Apache, Apache Lucene, Apache Hadoop, Hadoop, HDFS and the yellow elephant
logo are trademarks of the
Apache Software Foundation
in the United States and/or other countries.