We have had Elasticsearch [1] running in a production environment for a while, and started doing some analysis on performance. Unfortunately, our performance seems to be very hit or miss.
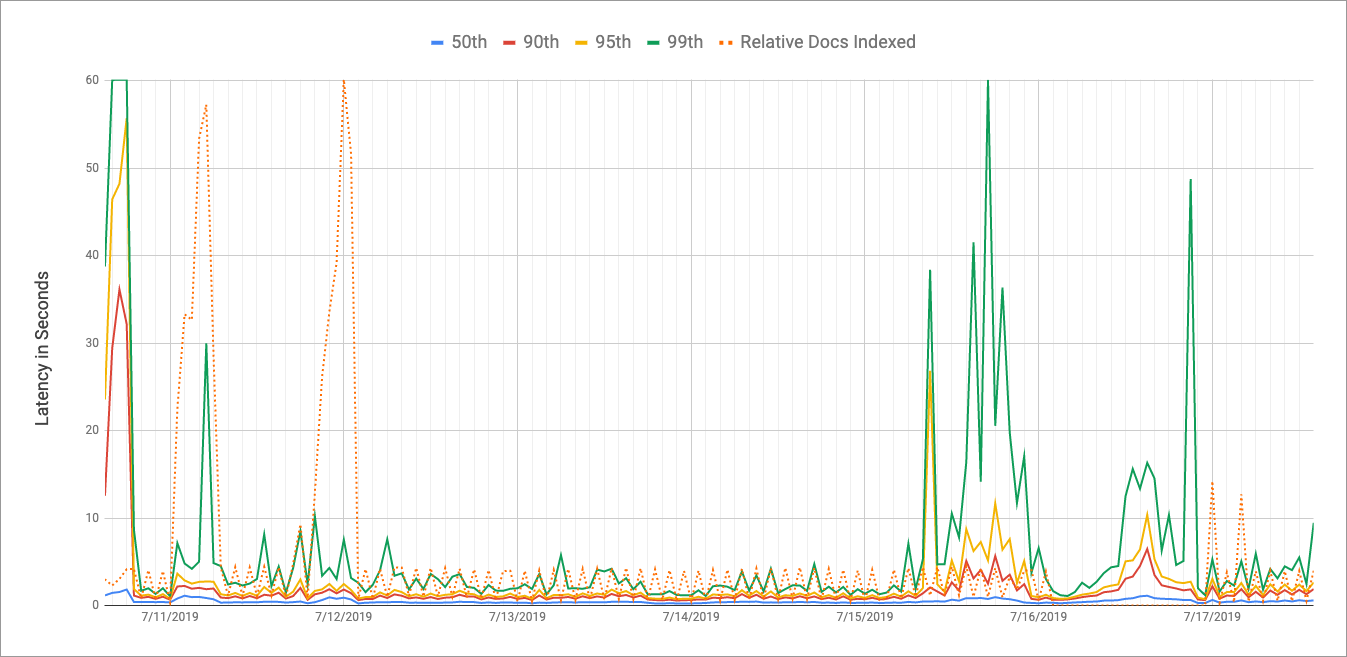
Our 50th percentile is usually around 500ms, but from there, it gets more erratic, with 90th ranging from 1-3 seconds, 95th from 1-4.5 seconds, and 99th all over the place, from 2 to almost 20 seconds! And as far as load, it's usually between 0.5 and 2 requests per second, so nothing ridiculous.

The cluster is made up of 3 nodes (deployed on Kubernetes stateful sets) with 64GB memory & 500GB storage each. The configuration is 3 shards, 2 replicas, and 9 indexes. Each index varies in number of docs and width, but here's the breakdown:
| index | pri | rep | docs.count | docs.deleted | store.size | pri.store.size |
|---|---|---|---|---|---|---|
| 1 | 3 | 2 | 501 | 0 | 4mb | 1.3mb |
| 2 | 3 | 2 | 517752 | 2413 | 1.8gb | 630.9mb |
| 3 | 3 | 2 | 6755 | 107 | 23.5mb | 7.9mb |
| 4 | 3 | 2 | 201879 | 60 | 749.7mb | 251.1mb |
| 5 | 3 | 2 | 50 | 40 | 3mb | 1mb |
| 6 | 3 | 2 | 1457952 | 10796 | 3.7gb | 1.2gb |
| 7 | 3 | 2 | 3012 | 2 | 8.1mb | 2.7mb |
| 8 | 3 | 2 | 82035 | 14303 | 949mb | 309.2mb |
| 9 | 3 | 2 | 3211492 | 123674 | 5.8gb | 1.9gb |
We have an ngram analyzer/filter that used to have min_gram: 2 and max_gram: 12, but I reduced max_gram to 6 in hopes that that had something to do with our latency, but it didn't seem to help much (this happened n-6 days on the graph above).
A lot of our requests are querying across _all indexes, but we also have requests querying individual indexes with similar performance. In spot tests, I'm seeing took come back ranging between a few ms, to over 1 second with the same query, within a few seconds of each other. I'm seeing this both on _all and individual indexes.
So, my questions:
-
Is what I'm seeing above seem pretty normal, or does something look off?
-
If something is off, where should I start? Node/shard/replica configuration? How data is getting indexed (i.e. ngram)? Node CPU/memory allocation?
-
Is there something I can do to further instrument (or maybe already instrumented that I could dig more into) that would help explain what's going on?
-
What other information can I provide here that would be helpful?
[1]
version: {
    number: "6.4.2",
    build_flavor: "default",
    build_type: "tar",
    build_hash: "04711c2",
    build_date: "2018-09-26T13:34:09.098244Z",
    build_snapshot: false,
    lucene_version: "7.4.0",
    minimum_wire_compatibility_version: "5.6.0",
    minimum_index_compatibility_version: "5.0.0"
}