I’m sorry, I’ve really run out of ideas on how to implement Elastic Agents on multiple endpoints and send the monitoring logs to the Elastic Stack.
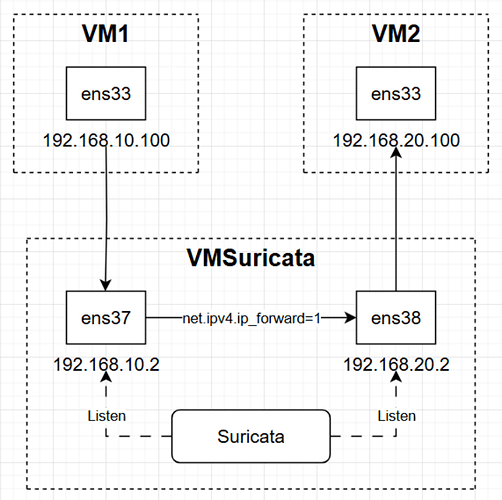
The architecture of my experimental environment consists of three Ubuntu virtual machines, with the traffic flow as follows: VM1 → VMSuricata → VM2.
* VM1: traffic sender (ens33: 192.168.10.100)
* VMSuricata: gateway (ens37: 192.168.10.2, ens38: 192.168.20.2)
* VM2: traffic receiver (ens33: 192.168.20.100)
On VMSuricata, I have deployed Elastic Stack 7.17.16 (Elasticsearch + Filebeat + Kibana) to collect and visualize the traffic events and alerts captured by Suricata. However, now I also want to deploy Elastic Agents on VM1 and VM2 in order to collect the sender-side traffic logs (on VM1) and receiver-side traffic logs (on VM2), and then forward this data into the Elastic Stack on VMSuricata for visualization.
I have tried several methods but none of them worked. My questions are:
* With this architecture and Elastic Stack version (7.17.x), is my goal actually achievable?
* Or should I shift to Elastic Stack 8.x instead?
If anyone has guidance, or can recommend some documentation or webpages that could help me achieve this, I would greatly appreciate it. Thank you so much!
