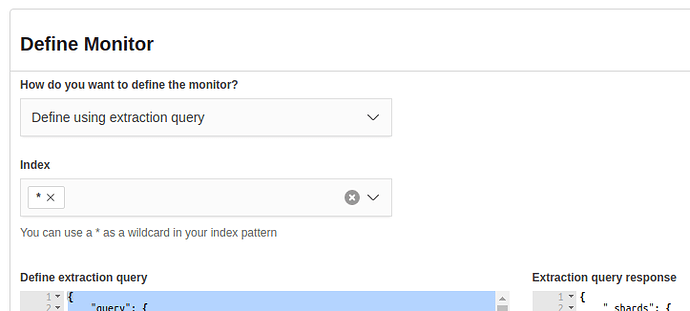
Hi, I’m defining a monitor for Kibana alerting and I’d like to include the service scripted field (which I’ve prepared) in the _source (or any other accessible field). I’d like to use that information in the Slack notification message, by doing something like {{_source.service}} . Currently, I don’t see a way to do it.
Defined extraction query
{
    "query": {
        "bool": {
            "must": [
                {
                    "range": {
                        "@timestamp": {
                            "from": "now-30m",
                            "to": null,
                            "include_lower": true,
                            "include_upper": true,
                            "boost": 1
                        }
                    }
                }
            ],
            "adjust_pure_negative": true,
            "boost": 1
        }
    },
    "_source": {
        "includes": [
            "country",
            "@timestamp",
            "timestamp",
            "service",
            "environment",
            "function_name",
            "level"
        ],
        "excludes": []
    }
}
Hits from extraction query response
"hits": {
        "hits": [
            {
                "_index": "some-index",
                "_type": "some-information",
                "_source": {
                    "country": "pl",
                    "environment": "prod",
                    "@timestamp": "2020-03-04T12:34:39.581Z",
                    "level": "ERROR",
                    "function_name": "dev.opendistrocommunity.discuss.problem",
                    "timestamp": "2020-03-04 12:34:39,581"
                },
                "_id": "3530...38",
                "_score": 10.790063
            }
        ],
        "total": 1,
        "max_score": 10.790063
    }
JSON information about log
{
  "_index": "...",
  "_type": "...",
  "_id": "3530...38",
  "_version": 1,
  "_score": null,
  "_source": {
    "correlation_id": "...",
    "request_id": "...",
    "message": "Internal Server Error",
    "timestamp": "2020-03-04 10:43:26,751",
    "level": "ERROR",
    "function_name": "dev.opendistrocommunity.discuss.problem",
    "thread": "...",
    "environment": "prod",
    "country": "pl",
    "@id": "3530...38",
    "@timestamp": "2020-03-04T10:43:26.751Z",
    "@message": "...",
    "@owner": "...",
    "@log_group": "...",
    "@log_stream": "..."
  },
  "fields": {
    "service": [
      "_____INFORMATION-I-NEED-IS-HERE______"
    ],
    "@timestamp": [
      "2020-03-04T10:43:26.751Z"
    ]
  },
  "highlight": {
    "level": [
      "@kibana-highlighted-field@ERROR@/kibana-highlighted-field@"
    ]
  },
  "sort": [
    1583318606751
  ]
}
I have defined Monitor by Define using extraction query and general index *, for which the mentioned scripted field is defined.
I’d appreciate some help.
