Kibana version: 7.16.3
Elasticsearch version: 7.16.3
APM Server version: 7.16.3
APM Agent language and version: java 1.29.0
Browser version: irrelevant
Original install method (e.g. download page, yum, deb, from source, etc.) and version: ECK 1.9.1
Fresh install or upgraded from other version? fresh
Is there anything special in your setup?
- I created a cluster in azure using aks and installed everything using the ECK operator 1.9.1, default operator configuration.
- I am using 2 elastic master nodes with only the master role and 2 data nodes with data, transform and ingest roles
- Installed certmanager 1.7.0 in the cluster for tls certificate using lets encrypt
- Installed istio for the ingress gateway
- http.tls.selfSignedCertificate.disabled=true for apmserver, Elasticsearch and kibana
- exposed all 3 services via a https url (all working fine)
- java agent is in another cluster (application cluster) and looks fine, installed using init-container following this tutorial
Description of the problem including expected versus actual behavior. Please include screenshots (if relevant):
There are missing and duplicated traces in the requests when the request is too slow. For example, the following image (full_request), shows a fast and complete transaction with all traces (db queries)
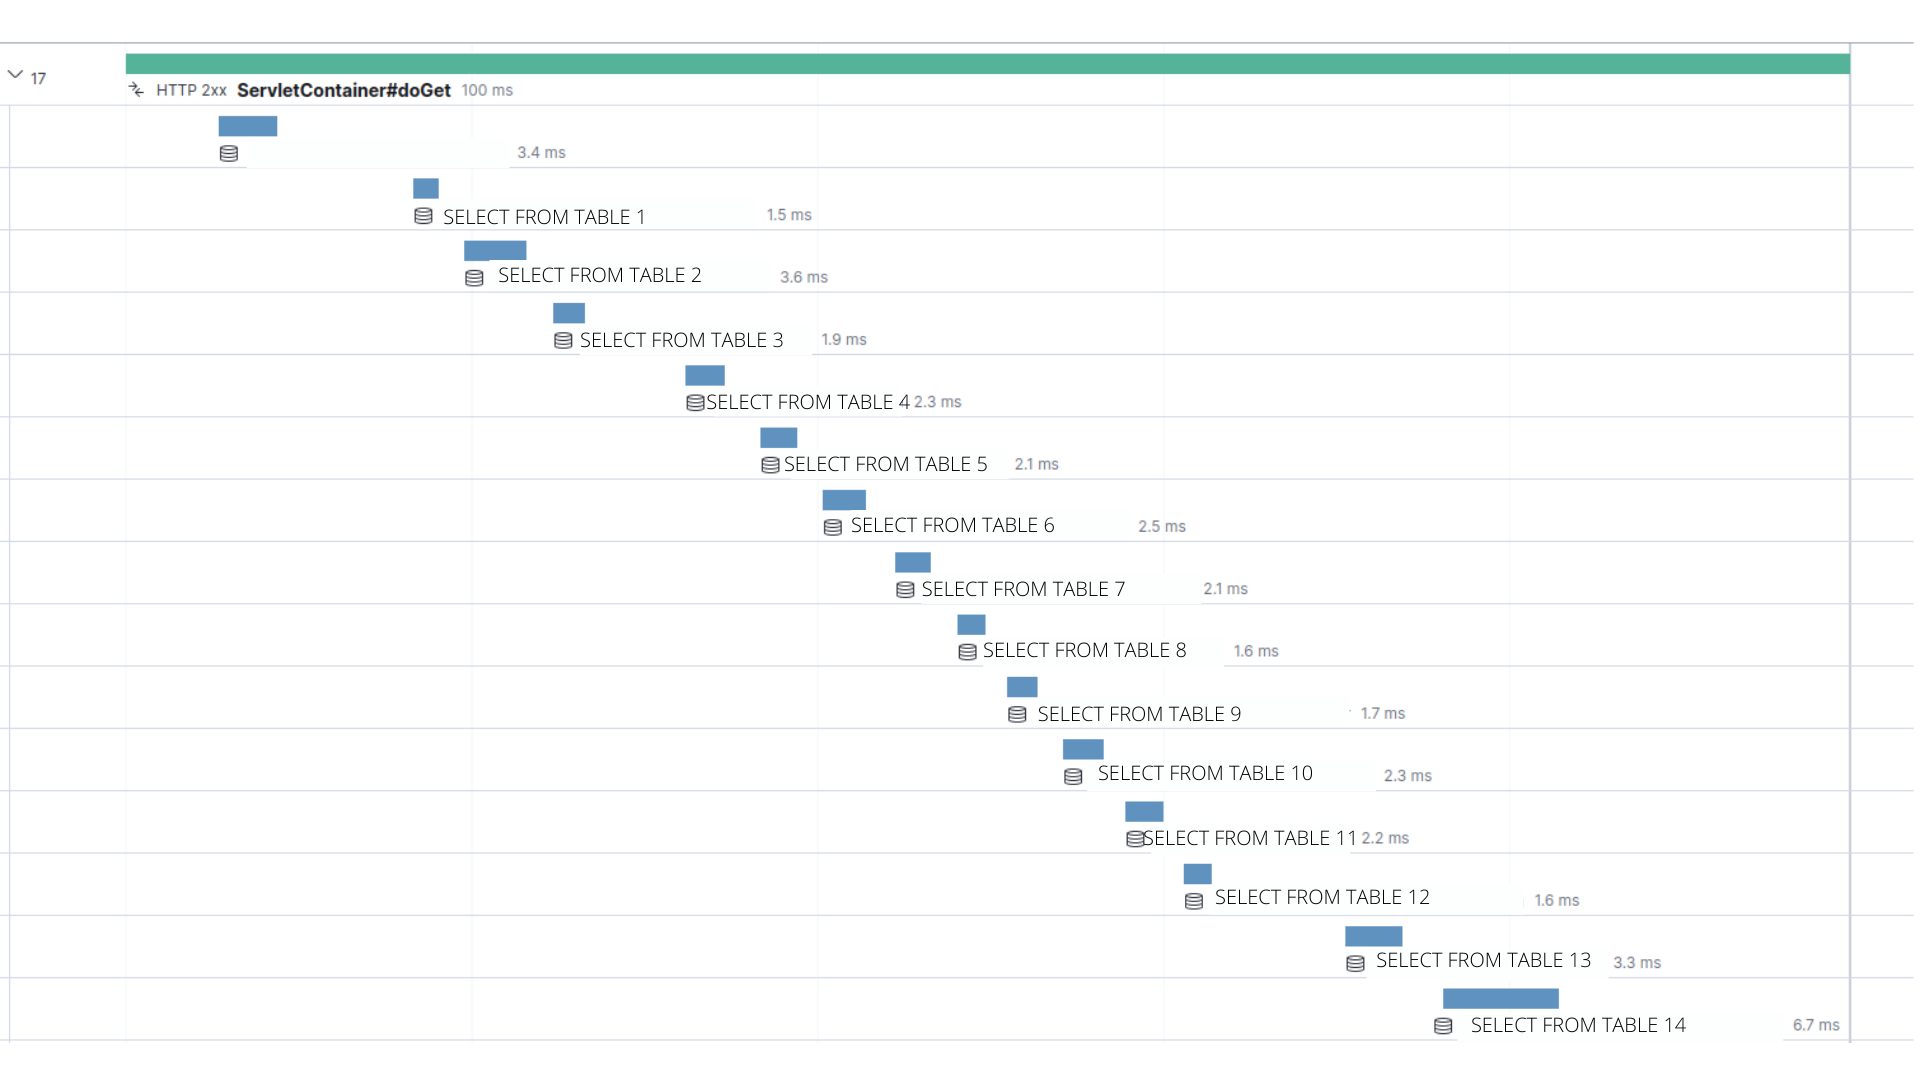
You can see the total time is 100ms, which is fine. But every time I have to analyze a slow request I see duplicated or sometimes triplicated traces, and there is always some missing queries and/or requests, as the image below shows

As you can see, in the fast request we got 17 different traces (queries), which I double checked in the backend and it is exactly what happens, but in the slow request we have only 8 requests (queries) with some duplicated.
So the expected result if for the slow request to have a transaction with 17 different queries, but it has only 8 with some duplicated.
ps1: In both images is the exactly same request, just a GET https://my_endpoint/static_link
ps2: the first image was cut and it is not showing the last 2 queries, but they are there. (this editing thing is not one of my strengths)
Steps to reproduce: could not reproduce in an "agnostic" environment
Any idea how I could find what is the problem?
Appreciate your attention!