Incomplete response JSON

Summary

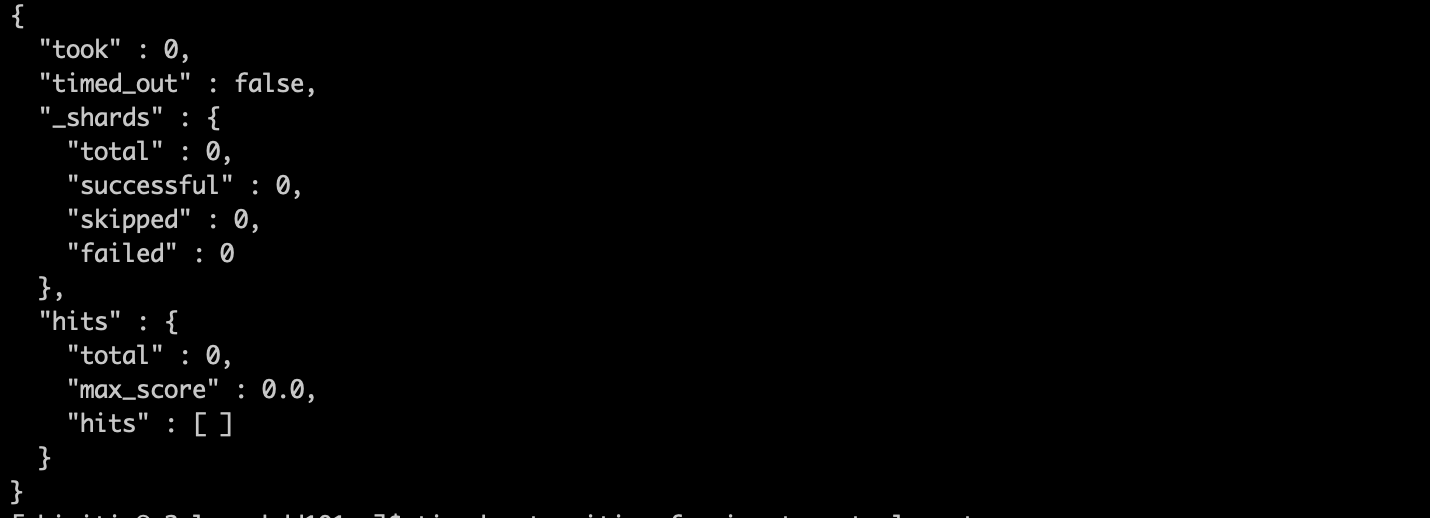
When I fire the query ( using curl -X GET ) from my Linux machine the output JSON is not complete.
the aggregation output is missing.
screenshots attached. Please help

 curl -X GET "http://10.5.245.31:9200/response_hdd11*/_search?pretty" -H 'Content-Type: application/json' -d'
{
  "size": 0,
  "_source": {
    "excludes": []
  },
  "aggs": {
    "1": {
      "sum": {
        "script": {
          "source": "doc['AB1C_response.keyword'].length",
          "lang": "painless"
        }
      }
    }
  },
  "stored_fields": [
    "*"
  ],
  "script_fields": {
    "number_of_requests": {
      "script": {
        "source": "doc['AB1C_request.keyword'].length",
        "lang": "painless"
      }
    },
    "success_response": {
      "script": {
        "source": "doc['AB1C_response.keyword'].length",
        "lang": "painless"
      }
    },
    "Timeouts": {
      "script": {
        "source": "doc['failure_response.keyword'].length",
        "lang": "painless"
      }
    }
  },
  "docvalue_fields": [
    "@timestamp",
    "formatted_time"
  ],
  "query": {
    "bool": {
      "must": [
        {
          "range": {
            "@timestamp": {
              "gte": 1547592761660,
              "lte": 1547635961660,
              "format": "epoch_millis"
            }
          }
        }
      ],
      "filter": [
        {
          "match_all": {}
        }
      ],
      "should": [],
      "must_not": []
    }
  }
}'

It looks like it is missing as it did not find any results. It would probably help if you also showed the query and which indices it targets.

Yes, thanks. I noticed it as soon as I posted the question. Apologies

I think I have accidentally posted the query back in the main question ( just getting use to the interface :wink: )

What does the query run in Kibana Console look like?

GET /response_hdd11*/_search?pretty
{
  "size": 0,
  "_source": {
    "excludes": []
  },
  "aggs": {
    "1": {
      "sum": {
        "script": {
          "source": "doc['AB1C_response.keyword'].length",
          "lang": "painless"
        }
      }
    }
  },
  "stored_fields": [
    "*"
  ],
  "script_fields": {
    "number_of_requests": {
      "script": {
        "source": "doc['AB1C_request.keyword'].length",
        "lang": "painless"
      }
    },
    "success_response": {
      "script": {
        "source": "doc['AB1C_response.keyword'].length",
        "lang": "painless"
      }
    },
    "Timeouts": {
      "script": {
        "source": "doc['failure_response.keyword'].length",
        "lang": "painless"
      }
    }
  },
  "docvalue_fields": [
    "@timestamp",
    "formatted_time"
  ],
  "query": {
    "bool": {
      "must": [
        {
          "range": {
            "@timestamp": {
              "gte": 1547592761660,
              "lte": 1547635961660,
              "format": "epoch_millis"
            }
          }
        }
      ],
      "filter": [
        {
          "match_all": {}
        }
      ],
      "should": [],
      "must_not": []
    }
  }
}

Are these queries both being sent to the same node? How many nodes do you have in the cluster?

If you have multiple nodes in the cluster, do you get the same response if you send the request to different nodes using curl?

its a 3 node cluster ( attached screenshot). I pointed the query to other nodes as well. But still the same response 43%20PM

curl -X GET "http://10.5.245.26:9200/response_hdd11*/_search?pretty" -H 'Content-Type: application/json' -d'
> {
>   "size": 0,
>   "_source": {
>     "excludes": []
>   },
>   "aggs": {
>     "1": {
>       "sum": {
>         "script": {
>           "source": "doc['AB1C_response.keyword'].length",
>           "lang": "painless"
>         }
>       }
>     }
>   },
>   "stored_fields": [
>     "*"
>   ],
>   "script_fields": {
>     "number_of_requests": {
>       "script": {
>         "source": "doc['AB1C_request.keyword'].length",
>         "lang": "painless"
>       }
>     },
>     "success_response": {
>       "script": {
>         "source": "doc['AB1C_response.keyword'].length",
>         "lang": "painless"
>       }
>     },
>     "Timeouts": {
>       "script": {
>         "source": "doc['failure_response.keyword'].length",
>         "lang": "painless"
>       }
>     }
>   },
>   "docvalue_fields": [
>     "@timestamp",
>     "formatted_time"
>   ],
>   "query": {
>     "bool": {
>       "must": [
>         {
>           "range": {
>             "@timestamp": {
>               "gte": 1547592761660,
>               "lte": 1547635961660,
>               "format": "epoch_millis"
>             }
>           }
>         }
>       ],
>       "filter": [
>         {
>           "match_all": {}
>         }
>       ],
>       "should": [],
>       "must_not": []
>     }
>   }
> }'
{
  "took" : 0,
  "timed_out" : false,
  "_shards" : {
    "total" : 0,
    "successful" : 0,
    "skipped" : 0,
    "failed" : 0
  },
  "hits" : {
    "total" : 0,
    "max_score" : 0.0,
    "hits" : [ ]
  }
}

we are past the previous scenario , now we are getting some error . I tried with a different query this time
55%20PM%201

query at the backend:

   curl -X GET "http://10.5.245.31:9200/response_hdd11*/_search?pretty" -H 'Content-Type: application/json' -d'
> {
>   "size": 0,
>   "_source": {
>     "excludes": []
>   },
>   "aggs": {},
>   "stored_fields": [
>     "*"
>   ],
>   "script_fields": {
>     "number_of_requests": {
>       "script": {
>         "source": "doc['AB1C_request.keyword'].length",
>         "lang": "painless"
>       }
>     },
>     "success_response": {
>       "script": {
>         "source": "doc['AB1C_response.keyword'].length",
>         "lang": "painless"
>       }
>     },
>     "Timeouts": {
>       "script": {
>         "source": "doc['failure_response.keyword'].length",
>         "lang": "painless"
>       }
>     }
>   },
>   "docvalue_fields": [
>     "@timestamp",
>     "formatted_time"
>   ],
>   "query": {
>     "bool": {
>       "must": [
>         {
>           "range": {
>             "@timestamp": {
>               "gte": 1547558066609,
>               "lte": 1547644466609,
>               "format": "epoch_millis"
>             }
>           }
>         },
>         {
>           "exists": {
>             "field": "AB1C_request.keyword"
>           }
>         }
>       ],
>       "filter": [
>         {
>           "match_all": {}
>         }
>       ],
>       "should": [],
>       "must_not": []
>     }
>   }
> }'
{
  "error" : {
    "root_cause" : [
      {
        "type" : "script_exception",
        "reason" : "compile error",
        "script_stack" : [
          "doc[AB1C_request.keyword].l ...",
          "    ^---- HERE"
        ],
        "script" : "doc[AB1C_request.keyword].length",
        "lang" : "painless"
      }
    ],
    "type" : "search_phase_execution_exception",
    "reason" : "all shards failed",
    "phase" : "query",
    "grouped" : true,
    "failed_shards" : [
      {
        "shard" : 0,
        "index" : "recharge_hdd11-2019.01.01",
        "node" : "gdHoshwiQ1-7SFIrxoNbsg",
        "reason" : {
          "type" : "script_exception",
          "reason" : "compile error",
          "script_stack" : [
            "doc[AB1C_request.keyword].l ...",
            "    ^---- HERE"
          ],
          "script" : "doc[AB1C_request.keyword].length",
          "lang" : "painless",
          "caused_by" : {
            "type" : "illegal_argument_exception",
            "reason" : "Variable [AB1C_request] is not defined."
          }
        }
      }
    ]
  },
  "status" : 500

query at kibana:

GET /response_hdd11*/_search?pretty
{
  "size": 0,
  "_source": {
    "excludes": []
  },
  "aggs": {},
  "stored_fields": [
    "*"
  ],
  "script_fields": {
    "number_of_requests": {
      "script": {
        "source": "doc['AB1C_request.keyword'].length",
        "lang": "painless"
      }
    },
    "success_response": {
      "script": {
        "source": "doc['AB1C_response.keyword'].length",
        "lang": "painless"
      }
    },
    "Timeouts": {
      "script": {
        "source": "doc['failure_response.keyword'].length",
        "lang": "painless"
      }
    }
  },
  "docvalue_fields": [
    "@timestamp",
    "formatted_time"
  ],
  "query": {
    "bool": {
      "must": [
        {
          "range": {
            "@timestamp": {
              "gte": 1547558066609,
              "lte": 1547644466609,
              "format": "epoch_millis"
            }
          }
        },
        {
          "exists": {
            "field": "AB1C_request.keyword"
          }
        }
      ],
      "filter": [
        {
          "match_all": {}
        }
      ],
      "should": [],
      "must_not": []
    }
  }
}

the output at kibana is attached

I one you have quotes around the field name and in the other you don't. Why don't you simply copy the query body so you are sure you are comparing the same thing?

i have some sensitive information in the code. Can i somehow blur it ?

the only changes which I made to the query before posting was to change the name of some confidential content. Nothing else apart from that

I think I have got it figured out.

Looks like you can only query scripted fields from Kibana console. I removed the scripted fields part from the query and then fired it. I got the count

    $ curl -X GET "http://10.5.245.31:9200/response_hdd11*/_search?pretty" -H 'Content-Type: application/json' -d'
    > {
    >   "size": 0,
    >   "_source": {
    >     "excludes": []
    >   },
    >   "aggs": {},
    >   "stored_fields": [
    >     "*"
    >   ],
    >   "docvalue_fields": [
    >     "@timestamp",
    >     "formatted_time"
    >   ],
    >   "query": {
    >     "bool": {
    >       "must": [
    >         {
    >           "range": {
    >             "@timestamp": {
    >               "gte": 1547558066609,
    >               "lte": 1547644466609,
    >               "format": "epoch_millis"
    >             }
    >           }
    >         },
    >         {
    >           "exists": {
    >             "field": "AB1C_request"
    >           }
    >         }
    >       ],
    >       "filter": [
    >         {
    >           "match_all": {}
    >         }
    >       ],
    >       "should": [],
    >       "must_not": []
    >     }
    >   }
    > }'
    {
      "took" : 43,
      "timed_out" : false,
      "_shards" : {
        "total" : 80,
        "successful" : 80,
        "skipped" : 0,
        "failed" : 0
      },
      "hits" : {
        "total" : 267594,
        "max_score" : 0.0,
        "hits" : [ ]
      }
    }

Christian, Thank you for your quick responses. Also, please let me know if my hypothesis about the querying the scripted fields via curl is right or wrong.

cheers :slight_smile:

This topic was automatically closed 28 days after the last reply. New replies are no longer allowed.