Increased Read IOPS usage after upgrade from 8.18.0 to 9.0.1

Hi all,

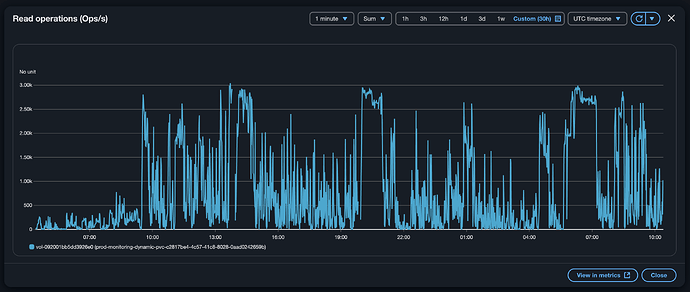
since upgrading from 8.18.0 to 9.0.1 i'm seeing a massive increase of read IOPS on the data node disks.
I couldn't see anything obvious in the release notes of 8.18.1, 9.0.0 and 9.0.1 that would lead to this.
Here's a screenshot of it:

Has anyone experienced the same or knows if it is a known issue - or even expected?

2 Likes

Welcome to the forum Sebastian.

How long were you on 8.18.0? Hours/days? What were you on before? Did the IOPS increase come only after the 9.0.1 upgrade, not the 8.18.0 upgrade ?

Did the Upgrade Assistant suggest anything before going to 9.0.1, and did you follow those suggestions?

Can you map the increased IOPS to specific set of indices, using kibana or other tools ?

1 Like

Thank you for the warm welcome!

How long were you on 8.18.0?

We've been running 8.18.0 for ~9 days on a cluster with ~5.4TB of data.

What were you on before?

Our prior version to 8.18.0 was 8.17.3.

Did the IOPS increase come only after the 9.0.1 upgrade, not the 8.18.0 upgrade ?

The IOPS increase came after moving from 8.18.0 to 9.0.1. We didn't experience it with 8.18.0

Did the Upgrade Assistant suggest anything before going to 9.0.1, and did you follow those suggestions?

Which upgrade assistant do you mean?
We are using ECK operator v3.0.0 if that answers the question.

Can you map the increased IOPS to specific set of indices, using kibana or other tools ?

I'm not aware on how to do it. Can you hint me into a direction on how to check what index would cause this?
However I don't believe that the usage pattern of the system have changed during the cluster upgrade.
What I can see is that only data node disks are affected, but I guess that is obvious.

Thanks for all the straight answers, you'd be surprised how unusual that is!

The one under Stack Management (at the bottom, left side panel) in kibana. You can still look at it now, but you are really supposed to address things it highlights before going for version X to version X+1.

So, thats an interesting question. Does Elasticsearch itself support a mapping of IOPS (or a proxy) to specific index ? I don't know, hopefully someone else can confirm. You can look across your indices in kibana --> Stack Monitoring and see plenty of stats/graphs like indexing rate, search rate, ... - maybe there is something else with a similar (big increase) pre/post upgrade that can be used as a possible proxy?

There are a few ways to make some mapping from IOPS to actual files at OS layer, at least under Linux. iotop (or similar) would be one. I've never used it for this specific use case.

Not to ignore your question, but is there a downside you are seeing? i.e. an actual performance issue. Or is just that the increase you see in your monitoring tool is not understood ?

EDIT: I mis-recalled, iotop can give the PIDs, not the filename, but that PID could feed to lsof, but ... gets complicated. There's other IO tracing tools, depends on distribution a bit.

Just to follow up on this, but a new (to me) utility was sysdig, which supports little LUA scripts it calls chisels, one of which can be used to look for the filename / IO mappings, for reads/writes/etc. But I hope someone can point to an elastic-tools way to discover which indices are doing your unexpected reads.

The one under Stack Management (at the bottom, left side panel) in kibana. You can still look at it now, but you are really supposed to address things it highlights before going for version X to version X+1.

There's no blockers, only 3 warning. However they are not related to anything related (xpack configuration deprecation, http2 usage, internal api use).

Does Elasticsearch itself support a mapping of IOPS (or a proxy) to specific index ?

I wouldn't be aware of that. Also I don't see why Elastic would be the tool to monitor it. From my perspective a low level system tool should be able to track that, like you mentioned with sysdig.
Since we are using the official images from Elastic (which are stripped down and don't contain a package manager and lots of other tools are missing too), there doesn't seem to be a lot i see that i can easily do here.
There's curl inside, so theoretically i could search for an docker image that contains sysdig and is ABI compatible, but that sounds hacky.
iotop is btw. not included in that image, nor is lsof.

Stack monitoring is not set up on our end (and doesn't let me set it up), however we do have prometheus metrics for the cluster.
I will check if i can get any metric related to iops per index action there, but i'm not very confident there will be one.

Not to ignore your question, but is there a downside you are seeing? i.e. an actual performance issue.

In fact I did not see a real performance issue, BUT this increases our cloud provider bill + it triggers prometheus alerts (NodeMemoryMajorPagesFaults).
What I did see in the metrics so far is that document merges are up to 2 times slower than before (spikes).

I'll be happy to check any other route to solve it, if you come up with ideas. For the moment, I do only see the "search for metrics based on iops per index" route.

I wasn't asking that question of you, rather sort of rhetorically, and the other ELK experts on the forum - apologies for lack of clarity.

Well, I'm not saying it should or does or .... But it offers fairly low-level/fine grained tools for lots of things, via APIs, like disk usage, memory usage, query performance, hot threads, etc.

Yeah, absolutely, forget that. I understand the limitation that using the docker image gives you few tools, we should try to understand the issue via the tools you have.

That's useful, another data point. I presume you meant segment merges? Those done automatically by the system, or you are doing some merging yourselves?

... and another.

You actual use case, summarized in a few words is ... ? i.e. what sort of data is your 5TB of stuff stored in elasticsearch?

Your indices, the actual indices you can see from _cat/indices, are "the same" as before? Meaning only, for example, that you ingested say 10 millions docs per day, and you still ingest roughly 10 million docs per day, and the storage size per index and per document look very similar too? You do significant number of deletes ?

If prometheus has any stats on iops per index I'd also be surprised, but maybe there is a useful API I am just forgetting (or never knew).

A very interesting mystery!
The metric used to determine this is elasticsearch_indices_merges_total_time_seconds_total.
We are not doing any manual merges.

This is a plain log storage system.
We use only datastreams (and their underlaying indices ofcourse) + a kibana for search.

The data ingestion hasn't changed at all. Also it would be quite random that the ingestion changes with the update. The time for the increase of iops usage really comes down to replace time of the first elasticsearch data node pod.

We do use index lifecycle management for letting the system delete old data, but as the same amount of data comes in, the same amount of data gets deleted too.
There are no manual deletes done.
I haven't observed any major changes in the volume disk usage, so it doesn't look like there was any optimization for indices being done or so. However that would've been something i could've imagined due to the lucene update included. On the other hand i would've expected a note in the release notes about this process being run after upgrade.

I've had a look at the prometheus metrics from the elasticsearch exporter and I could see io related metrics, but they don't contain a label for the index. I'll check however if I can enable more detailed metrics for the exporter as I already know that we did intentionally not enable all metrics (as there is lots of information that exporter can receive from elasticsearch)

I had a look at the release notes and one thing I did notice is that logsdb now is enabled by default for data streams matching the logs-* pattern. It mentions that this has an indexing overhead impact, which I suspect could also affect merging. Do you have data streams that match this naming pattern?

Notwithstanding @Christian_Dahlqvist logsdb idea, I'd be quite surprised if prometheus directly knew anything about read IOPS / index or filename mappings.

BUT, AFAIK it uses the _all/_stats endpoint, it could give you info on segments / merges per index, which I had not noticed, though you would need to have the pre-9.0.1 data to compare that to to see if there is a big increase. You can check if those metrics are already in your prometheus data.

In fact we do, however i do see in our logs output of the data node upon start updating [cluster.logsdb.enabled] from [true] to [false].
So I assumed it would in fact be disabled.
We do have set logsdb.prior_logs_usage=true in our cluster settings.

I did not observe any changes in amount of merged here.

What I did see now is that upon elastic data pod restart the nodes node_vmstat_pgmajfault metric goes up a lot.
The same seems to happen during shards relocation.

Mmmm. This IS an interesting issue!

Is that maybe suggesting that your IO read issue might actually be a bit different, there are maybe more reads to the actual disk as there are less being fulfilled by file system cache, less than before, as there is now more memory pressure which means less cache to work with?

(btw your not using swap at all on the nodes are you?)

The vol-092…. graphic in your very first post - what is on that volume ?

I’d assumed it was your data node’s disk for elasticsearch data, and just that? Now I’m wondering. It’s not got a swap partition/file on it too?

I do currently run the data pods on nodes that have plenty of free system memory that can be used for caching and buffering. Also there is no swap file in use at all. This is what I at first thought would be used when the node_vmstat_pgmajfault is > 0, as it points to "alternative data path" being used.

Thats the regular data volume for elasticsearch, it's an identifier from AWS. Nothing more on it.

I did not get any new insides from the additional metrics that i do let the elasticsearch exporter provide, sadly.

Any other ideas are still welcome.

Hi

So, I’m on holidays so likely won’t answer again for a while. I think we need a new idea.

Your graphic was on IO to the data disk, thank for confirming that, but your NodeMemoryMajorPagesFaults alert was on major page faults. And you say there’s no swap. And those page fault Alerts are on the nodes running the elasticsearch pod, right?

So page faults mean a process in trying to access something that’s not currently in RAM. Now, that almost always means memory pressure, and often but NOT always the something is fetched from swap. I think the explanation here:

Is pretty good. I’m quoting just the conclusion:

Conclusion

Major page faults means that there's heavy disk read activity, either from a file OR from swap

Your case has to the first, as it’s not the second.

In a sense this is circular, we’re just back at the original problem. But, maybe not.

At node level you maybe have more opportunity to use some of the tools I suggested or from above article, to nail down exactly that file(s).

But my own hunch is you have a memory issue masquerading as an IO issue. Give more memory to your elasticsearch data nodes, and I hope that allocation is fixed and not a min << max thing, and see if IO situation improves. And/or investigate the RAM usage in detail via the APIs in parallel.

Edit: Sorry, I didn’t understand this in your post:

??

This essentially means what you wrote in your post: reading from swap instead of system memory.

I did yesterday scale up the memory A LOT. Originally we were using 25Gb memory request with 20GB XMS/XMX setting, my increase was to 100gb/80gb. The issue stayed the same.

Using the host instead of the container is indeed an option i will consider next. Otherwise the only solution for us is to turn away from elasticsearch as our log storage (which is kinda funny, because that is one of the major use cases for elasticsearch for us since quite some years and never turned us down).

Thanks for all your ideas @RainTown and have a nice vacation!

Note that you should never set the heap size to more than 50% of available RAM on the host. Elasticsearch in recent versions sets this correctly automatically. If the page cache is not getting hit enough it is off-heap memory you need to increase, so if increasing the amount of RAM you should keep the heap size as it was before (unless you are seeing evidence of heap pressure in the form of long or frequent GC in the Elasticsearch logs). I would therefore recommend you try with 100GB RAM and 20GB heap.

Whoa! That would seems a tad premature.

From following this forum for a while, with these “interesting mysteries” threads there’s often a key element that’s hidden or misunderstood. Not for nefarious reason, just … doesn’t emerge quickly.

It changed the situation to the better, but still the iops used and page major faults are way bigger than before.
I will keep the memory raised for now (not the numbers from your suggestion though).

What did you set them to? Why not use the settings I provided?

1 Like