We are using 1.7.1
We use bulk writes and each write can have data for multiple shards. We have seen a significant drop in the occurrence of these spikes if we put in a layer of client nodes ahead of the cluster to perform the routing.
i will be happy to provide more info if needed.
Hi again, there are jstack, hot threads & diagnostics outputs for overloaded node - https://drive.google.com/file/d/0B_Oocixp2T-KcnBiZXc1cGpoYUU/view?usp=sharing
When you see an ES node's thread(s) stuck doing this:
does it ever recover on its own? If you pull hot threads a while later, are the same threads still stuck at this spot? Or is killing the node the only way to clear it up?
I'm now wondering if you're hitting a JVM bug; this ThreadLocalMap is a custom hash map and it's somewhat spooky looking, and I'm wondering if it has adversaries (JVM bug) that cause it to spin forever.
Here's what the code in expungeStaleEntry looks like:
                        // Unlike Knuth 6.4 Algorithm R, we must scan until
                        // null because multiple entries could have been stale.
                        while (tab[h] != null)
                            h = nextIndex(h, len);
                        tab[h] = e;
I especially don't like this comment since it starts with "Unlike Knuth" ![]() I think in your case this while loop may never terminate because
I think in your case this while loop may never terminate because nextIndex keeps probing non-null entries in a loop...
Yes i have seen the same thread stuck in this state.
the only way to clear up this is to send a QUIT signal to the process.
But this does not explain why the issue was resolved after adding clientNodes ?
What I meant was: once a thread is stuck here, is it forever here? I'm trying to differentiate between "threads are forever stuck in this code" vs "they are spending a lot of time in this code" (which may be because ES is creating too many ThreadLocals or something).
But this does not explain why the issue was resolved after adding clientNodes ?
Is this a 100% reliable workaround?
Maybe this changed a bit how the ES nodes are using ThreadLocals and sidestepped the (possible) JVM bug? Or this is not a JVM bug at all and something else is at work (too many ThreadLocals).
Our current workaround is to stop uploading data for 20-30min, and after continuing uploading, node with bulk queue is disappearing and indexing speed is greatly increasing. At the moment, we do it every late evening, seems because indices become very large at the evening.
I run this OQL script on jhat to collect some statistics:
select (function(table){
    var max_nonnull_range = 0;
    var current_range_value = 0;
    var nonnull_entries = 0;
    var nonnull_key_count = 0;
    var nonnull_value_count = 0;
    var nonnull_value_value_count = 0;
    var nonnull_value_value_classname = {};
    for(var i = 0; i < table.length; i++) {
        if(table[i]) {
            nonnull_entries++;
            current_range_value++;
            if(max_nonnull_range < current_range_value) {
                max_nonnull_range = current_range_value;
            }
            var entry = table[i];
            if(entry.referent) {
                nonnull_key_count++;
            }
            if(entry.value) {
                nonnull_value_count++;
                if(entry.value && entry.value.referent) {
                    nonnull_value_value_count++;
                    var key = classof(entry.value.referent).name;
                    if(typeof nonnull_value_value_classname[key] != "undefined") {
                        nonnull_value_value_classname[key]++;
                    } else {
                        nonnull_value_value_classname[key] = 1;
                    }
                }
            }
        }
        else {
            current_range_value = 0;
        }
    }
    return {
        "table_length": table.length,
        "max_nonnull_range": max_nonnull_range,
        "nonnull_entries": nonnull_entries,
        "nonnull_key_count": nonnull_key_count,
        "nonnull_value_count": nonnull_value_count,
        "nonnull_value_value_count": nonnull_value_value_count,
        "nonnull_value_value_classname": nonnull_value_value_classname
    };
})(s.threadLocals.table)
from java.lang.Thread s
where /bulk/.test(s.name)
Here is the output for dumps of Elasticsearch in different states: http://pastebin.com/Wzi0FGVE
I see that probably the cause of high CPU usage and appearing methods of ThreadLocal class in hot threads is in big ranges of entries in that table. But the only one big difference of dumps between overloaded and resting node is in count of non-null keys in entries.
By the way, we don't see expungeStaleEntry in hot threads, but getEntryAfterMiss.
So we had this issue again, and so it shows that this is not a reliable workaround. this issue is happening whenever there is spike in index and search call volume.
From our logs from the recent event, we see that too many threads are in this state based on the load on the system.
state been using ThreadLocals, after the load dies down the cpu goes down but does not recover completely
I don't have near the same info as you do Arun, but we have been seeing something similar, see here: CPU usage slowly climbs until ES needs a restart
We're going to upgrade to ES 2.x and see if this continues, we're currently on 1.7.4. I've been following this post and if there's something I can help provide I'm happy to do so.
We have changed GC from G1 to default (not CMS), and problem disappeared, it seems... Of course, log now has entries from GC about long duration (5-10s), but... cluster works normal, indexing speed is 100M/5min with low LA... Sounds strange.
We decided to switch GC to CMS and later to G1 again to see if the problem will return.
Thanks for the update ... with CMS, even though you have long collections, do you still see hot threads stuck reclaiming ThreadLocal?
Can anyone else confirm switching away from G1 GC "fixes" these bad hot threads?
I never had ThreadLocal issues with G1 GC. For G1 GC, I removed -XX:+DisableExplicitGC from bin/elasticsearch.in.sh because it's unpredictable and unreliable, it does not prevent GC, instead I assume it prevents some ordinary full GC runs, but G1 GC is requiring just that to function properly.
Maybe the option -XX:-UseBiasedLocking should also be set, but it may depend on the CPU (!), Sandy Bridge or later, or not: http://mechanical-sympathy.blogspot.de/2011/11/java-lock-implementations.html
I'll see if we can test this, when I grabbed the hot threads when this happened earlier this week I saw java.lang.ThreadLocal$ThreadLocalMap.expungeStaleEntry(ThreadLocal.java:617).
@mikemccand no, I don't see any menthion of ThreadLocal at all. More than that, I noticed that Lucene merges don't make strong pressure on disks as it were.
@jprante we have -XX:+DisableExplicitGC by default with ES, could it be the cause? We also will try to turn off this option. As for biased locks, I don't see the real difference between biased and non-biased locks on the graphs... moreover, AMD is working on our hosts
Well, we have tried to change GC, here are the results:
- Default GC - worked fine till it has been changed;
- G1 GC without
-XX:+DisableExplicitGC- no, didn't helped. One of nodes still becomes overloaded with the same symptoms. - CMS GC (original
elasticsearch.in.shwithout changes) - works perfect, and even throughput is greater, without long GC pauses.
Yeah, you are right with your default configuration. Well done, guys, keep up the good work!
As for G1, may be submit a bug for it? But I don't know how it can be reproduced in code.
Hey Ivan,
We made the change from G1 to CMS on only one node in our cluster so far. In the 4 days since, so far the CMS node is looking good while one of the G1 nodes is already acting up like usual. Our problem manifests itself over a ~7-10 day period so I'm not ready to say anything more than that just yet.
I started seeing this issue again, i have followed the same steps for one of the host, changes the gc to CMS from G1, ill update the ticket in a day or so, as our host goes into this state in a day.
I'm pretty close to calling our issue solved by moving to CMS. The G1 nodes continues to need restarting every few days while the CMS node has now been up for almost 12 days without any issues. This is a significant record for us 
We'll likely be swapping the GC on the whole cluster here shortly.
We made the switch from G1 to CMS on the entire stack and not only has it indeed, solved the run away CPU problem, look at how much more stable the response times have:
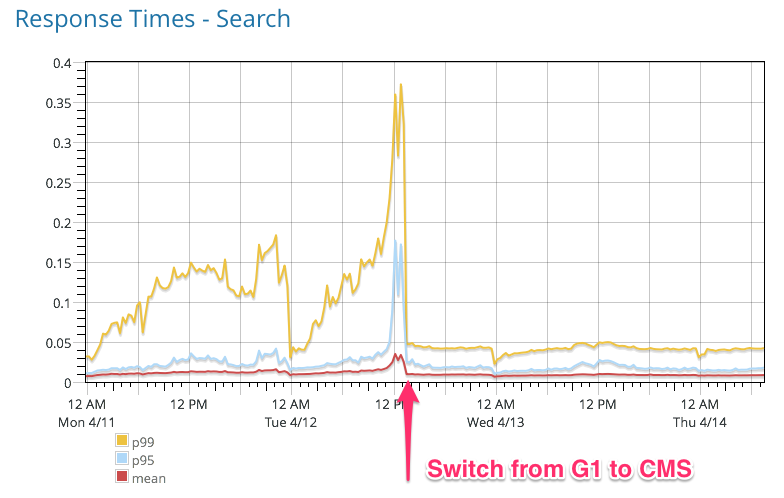
Crazy to see such a difference in the higher percentiles.
Thanks to everyone here who helped figure this out, I can stop complaining about ES now 
Can you specify your Machine (CPU cores, RAM, disks), OS, and JVM including JVM parameters?
It would be interesting to reproduce. From my numbers, I see it just the other way round 