Hi there, I'm a front-end developer with limited experience, therefore I'm a bit stuck at the moment.
I've applied Elastic RUM for the front-end (Angular) part of our single-page application. Our use case is to obtain performance metrics when users are traversing / clicking through the application. Unfortunately, because it is a single-page application, the user-centric metrics obtained during page-load don't suffice. We don't make use of the Angular router either.
From reading the documentation I figured I could use Custom Transactions to obtain user-centric metrics:
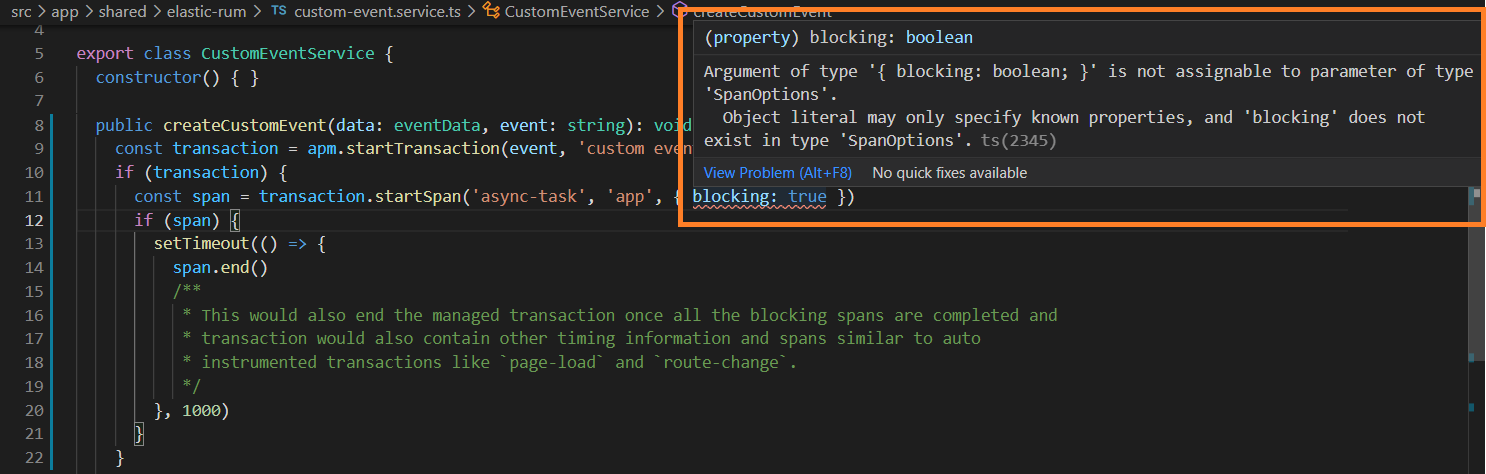
However, when attempting to use the code above an error is thrown, referring to { blocking: true } at line 4:
public createCustomEvent(data: eventData, event: string): void {
    const transaction = apm.startTransaction(event, 'custom event', { managed: true });
    if (transaction) {
      const span = transaction.startSpan('async-task', 'app', { blocking: true })
      if (span) {
        setTimeout(() => {
          span.end()
          /**
           * This would also end the managed transaction once all the blocking spans are completed and
           * transaction would also contain other timing information and spans similar to auto
           * instrumented transactions like `page-load` and `route-change`.
           */
        }, 1000)
      }
    }
    const url = 'URL_ADDRESS';
    if (transaction) {
    const httpSpan = transaction.startSpan('GET ' + url, 'external.http');
      if (httpSpan) {
        fetch(url)
        .then((resp) => {
            if (!resp.ok) {
            apm.captureError(new Error(`fetch failed with status ${resp.status} ${resp.statusText}`));
            }
            apm.addLabels(this.convertToLabels(data));
            httpSpan.end();
            transaction.end();
        });
      }
    }
  }
The custom transactions with managed: true would capture all timing information for requests and also other available user centric metrics like Long tasks, User Timing API, etc.
The any type did indeed fix the error, thanks!
However, changing my custom transaction to managed: true hasn't captured any user centric metrics yet, so I must be doing something wrong.
When it's a custom transaction like this, I receive the data as expected after clicking a button with labels.name: Selecteren.
public createCustomEvent(data: eventData, event: string): void {
    const transaction = apm.startTransaction(event, 'custom event');
    const url = 'URL_ADDRESS';
    if (transaction) {
      const httpSpan = transaction.startSpan('GET ' + url, 'external.http');
      if (httpSpan) {
        fetch(url)
        .then((resp) => {
            if (!resp.ok) {
              apm.captureError(new Error(`fetch failed with status ${resp.status} ${resp.statusText}`));
            }
            apm.addLabels(this.convertToLabels(data));
            httpSpan.end();
            transaction.end();
        });
      }
    }
  }
public createManagedEvent(data: eventData, event: string): void {
    const transaction = apm.startTransaction(event, 'custom event',  { managed: true });
    const url = 'URL_ADDRESS';
    if (transaction) {
      const span = transaction.startSpan('async-task', 'app', { blocking: true } as any )
      if(span) {
        setTimeout(() => {
          const httpSpan = transaction.startSpan('GET ' + url, 'external.http');
          if (httpSpan) {
            fetch(url)
            .then((resp) => {
                if (!resp.ok) {
                apm.captureError(new Error(`fetch failed with status ${resp.status} ${resp.statusText}`));
                }
                apm.addLabels(this.convertToLabels(data));
                httpSpan.end();
                transaction.end();
            });
          }
          span.end()
          /**
          * This would also end the managed transaction once all the blocking spans are completed and
          * transaction would also contain other timing information and spans similar to auto
          * instrumented transactions like `page-load` and `route-change`.
          */
        }, 1000);
      }
    }
  }
But this gives me pretty much the same output as before, with no user-centric metrics such as firstContentfulPaint / longtask/etc. data:
I suppose Long Tasks and User Timing would show up in this waterfall picture above?
I was hoping I could get user-centric metrics such as First Input Delay and First Contentful Paint, but after diving deeper into the topic I think this is pretty difficult data to gather from our Single-Page-Application.
Metrics like First Input Delay and First Contentful paint are reported for the initial page load navigation (hard navigation) which is why they show up for page-load transaction and not for subsequent transactions like route-change (soft navigation). The only metrics that you should be able to see for custom managed transactions would be ResourceTiming, UserTiming and Longtasks if available and reported by the browser.
You can double check if browsers report those metrics during the lifetime of the managed transaction by checking chrome devtools or by using the Performance API.
One last question though, are you 100% certain that route-changes don't show metrics such as First Input Delay and First Contentful Paint?
I'm asking because another (front-end) team within our company has also implemented Elastic RUM and unlike us, their project does make use of angular routing. When I look at their APM transactions I see those paths/routes and they do show First Input Delay/First Contentful Paint when I inspect them.
Hmmm Interesting, So when using the Angular package, we use the Angular route events to listen for all different SPA navigations, so it could be related to that.
Apache, Apache Lucene, Apache Hadoop, Hadoop, HDFS and the yellow elephant
logo are trademarks of the
Apache Software Foundation
in the United States and/or other countries.