JRE 1.7.0_11 / ES 1.0.1 - GC not collecting old gen / Memory Leak?
Hi,
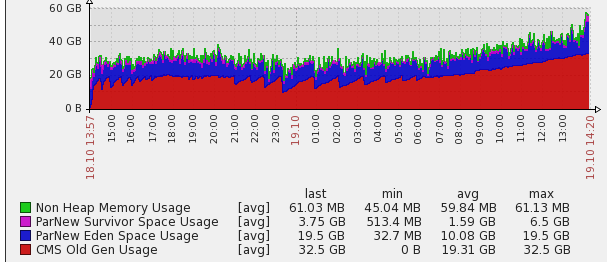
We're seeing issues where GC collects less and less memory over time
leading to the need to restart our nodes.
The following is our setup and what we've tried. Please tell me if anything
is lacking and I'll be glad to provide more details.
Also appreciate any advice on how we can improve our configurations.
Thank you for any help!
Gavin
Cluster Setup
-
Tribes that link to 2 clusters
-
Cluster 1
-
3 masters (vms, master=true, data=false)
-
2 hot nodes (physical, master=false, data=true)
-
2 hourly indices (1 for syslog, 1 for application logs)
-
1 replica
-
Each index ~ 2 million docs (6gb - excl. of replica)
-
Rolled to cold nodes after 48 hrs
-
-
2 cold nodes (physical, master=false, data=true)
-
-
Cluster 2
-
3 masters (vms, master=true, data=false)
-
2 hot nodes (physical, master=false, data=true)
-
1 hourly index
-
1 replica
-
Each index ~ 8 million docs (20gb - excl. of replica)
-
Rolled to cold nodes after 48 hrs
-
-
2 cold nodes (physical, master=false, data=true)
-
Interestingly, we're actually having problems on Cluster 1's hot nodes even
though it indexes less.
It suggests that this is a problem with searching because Cluster 1 is
searched on a lot more.
Machine settings (hot node)
-
java
-
java version "1.7.0_11"
-
Java(TM) SE Runtime Environment (build 1.7.0_11-b21)
-
Java HotSpot(TM) 64-Bit Server VM (build 23.6-b04, mixed mode)
-
-
128gb ram
-
8 cores, 32 cpus
-
ssds (raid 0)
JVM settings
java


-Xms96g -Xmx96g -Xss256k


-Djava.awt.headless=true


-XX:+UseParNewGC -XX:+UseConcMarkSweepGC
-XX:CMSInitiatingOccupancyFraction=75


-XX:+UseCMSInitiatingOccupancyOnly


-XX:+PrintGCDetails -XX:+PrintGCTimeStamps -XX:+PrintClassHistogram
-XX:+PrintTenuringDistribution

-XX:+PrintGCApplicationStoppedTime -Xloggc:/var/log/elasticsearch/gc.log
-XX:+HeapDumpOnOutOfMemoryError

-verbose:gc -XX:+PrintGCDateStamps -XX:+UseGCLogFileRotation
-XX:NumberOfGCLogFiles=10 -XX:GCLogFileSize=10M

-Xloggc:[...]


-Dcom.sun.management.jmxremote
-Dcom.sun.management.jmxremote.local.only=[...]


-Dcom.sun.management.jmxremote.ssl=[...]
-Dcom.sun.management.jmxremote.authenticate=[...]


-Dcom.sun.management.jmxremote.port=[...]


-Delasticsearch -Des.pidfile=[...]


-Des.path.home=/usr/share/elasticsearch -cp
:/usr/share/elasticsearch/lib/elasticsearch-1.0.1.jar:/usr/share/elasticsearch/lib/*:/usr/share/elasticsearch/lib/sigar/*

-Des.default.path.home=/usr/share/elasticsearch


-Des.default.path.logs=[...]


-Des.default.path.data=[...]


-Des.default.path.work=[...]


-Des.default.path.conf=/etc/elasticsearch
org.elasticsearch.bootstrap.Elasticsearch
Key elasticsearch.yml settings
-
threadpool.bulk.type: fixed
-
threadpool.bulk.queue_size: 1000
-
indices.memory.index_buffer_size: 30%
-
index.translog.flush_threshold_ops: 50000
-
indices.fielddata.cache.size: 30%
Search Load (Cluster 1)
-
Mainly Kibana3 (queries ES with daily alias that expands to 24 hourly
indices) -
Jenkins jobs that constantly run and do many faceting/aggregations for
the last hour's of data
Things we've tried (unsuccesfully)
-
GC settings
-
young/old ratio
-
Set young/old ration to 50/50 hoping that things would get GCed
before having the chance to move to old. -
The old grew at a slower rate but still things could not be
collected.
-
-
survivor space ratio
-
Give survivor space a higher ratio of young
-
Increase number of generations to make it to old be 10 (up from 6)
-
-
Lower cms occupancy ratio
- Tried 60% hoping to kick GC earlier. GC kicked in earlier but still
could not collect.
- Tried 60% hoping to kick GC earlier. GC kicked in earlier but still
-
-
Limit filter/field cache
-
indices.fielddata.cache.size: 32GB
-
indices.cache.filter.size: 4GB
-
-
Optimizing index to 1 segment on the 3rd hour
-
Limit JVM to 32 gb ram
-
Limit JVM to 65 gb ram
- This fulfils the 'leave 50% to the os' principle.
-
Read 90.5/7 OOM errors-- memory leak or GC problems?
- But we're not using term filters
32 GB Heap
https://lh3.googleusercontent.com/-T6uUeqSFhns/VEUMsYWwukI/AAAAAAAABm0/eayuSevxWNY/s1600/es_32gb.png
65 GB Heap
https://lh4.googleusercontent.com/-C9ScRI9pO2A/VEUM6uxcJ-I/AAAAAAAABm8/iGqqKemt4aw/s1600/es_65gb.png
65 GB Heap with changed young/old ratio
--
You received this message because you are subscribed to the Google Groups "elasticsearch" group.
To unsubscribe from this group and stop receiving emails from it, send an email to elasticsearch+unsubscribe@googlegroups.com.
To view this discussion on the web visit https://groups.google.com/d/msgid/elasticsearch/33c2b354-975d-4340-ad77-4d675e577339%40googlegroups.com.
For more options, visit https://groups.google.com/d/optout.