Hello,
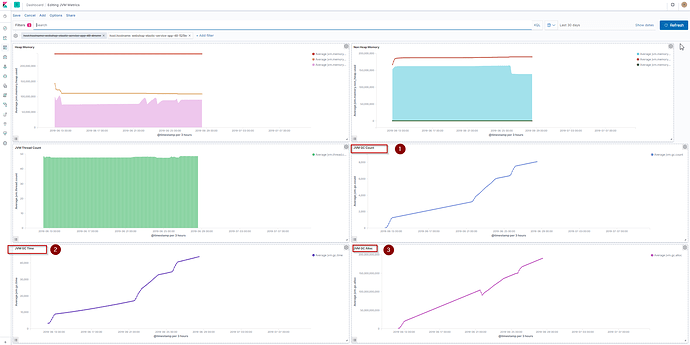
When monitoring jvm performance in our elastic cluster we get the following results shown in image1. As it can be detected from image 1 heap memory, non heap memory and thread count show probably a good performance.
image1
Nevertheless, JVM GC Count, JVM GC Time and JVM GC Alloc show a constant increase (numbers 1-2-3 in the diagrams).
Any help if this is an indication of a very poor performance and if yes why it occurs and how can be corrected?
