Hello,
I'm not really educated in this topic, but when I first saw this log in our logstash:
[2021-04-15T14:11:47,605][INFO ][logstash.outputs.elasticsearch][beats-monitoring-crypto][3228c43cca49b666651ceb4c7945f188f53b5e48f0efb9e5f9627ce96d04de35] retrying failed action with response code: 429 ({"type"=>"circuit_breaking_exception", "reason"=>"[parent] Data too large, data for [indices:data/write/bulk[s]] would be [7914649094/7.3gb], which is larger than the limit of [7820751667/7.2gb], real usage: [7914556632/7.3gb], new bytes reserved: [92462/90.2kb], usages [request=9184/8.9kb, fielddata=189099/184.6kb, in_flight_requests=24247630/23.1mb, model_inference=0/0b, accounting=46982278/44.8mb]", "bytes_wanted"=>7914649094, "bytes_limit"=>7820751667, "durability"=>"PERMANENT"})
I went through a few questions on Stackoverflow and here too, where it basically said to increase the heap size, so I did. It didn't took too much time and it appeared again just with different values:
retrying failed action with response code: 429 ({"type"=>"circuit_breaking_exception", "reason"=>"[parent] Data too large, data for [indices:data/write/bulk[s]] would be [10025661796/9.3gb], which is larger than the limit of [9775690547/9.1gb], real usage: [10025415888/9.3gb], new bytes reserved: [245908/240.1kb], usages [request=0/0b, fielddata=13538/13.2kb, in_flight_requests=245908/240.1kb, model_inference=0/0b, accounting=48939656/46.6mb]", "bytes_wanted"=>10025661796, "bytes_limit"=>9775690547, "durability"=>"PERMANENT"})
I went through docs and read something about breakers and queue sizes, that's actually how I later discovered, that the problem is regarding only about one data node, not the whole cluster. We have 3 hot nodes at the moment, each with same ubuntu version (18.04.5 LTS), same JDK bundled version (1.8.0_282) same jvm configuration:
-Xms10g
-Xmx10g
8-13:-XX:+UseConcMarkSweepGC
8-13:-XX:CMSInitiatingOccupancyFraction=75
8-13:-XX:+UseCMSInitiatingOccupancyOnly
-Des.networkaddress.cache.ttl=60
-Des.networkaddress.cache.negative.ttl=10
-XX:+AlwaysPreTouch
-Xss1m
-Djava.awt.headless=true
-Dfile.encoding=UTF-8
-Djna.nosys=true
-XX:-OmitStackTraceInFastThrow
-Dio.netty.noUnsafe=true
-Dio.netty.noKeySetOptimization=true
-Dio.netty.recycler.maxCapacityPerThread=0
-Dlog4j.shutdownHookEnabled=false
-Dlog4j2.disable.jmx=true
-Djava.io.tmpdir=${ES_TMPDIR}
-XX:+HeapDumpOnOutOfMemoryError
-XX:HeapDumpPath=/data/els
-XX:ErrorFile=/var/log/elasticsearch/hs_err_pid%p.log
8:-XX:+PrintGCDetails
8:-XX:+PrintGCDateStamps
8:-XX:+PrintTenuringDistribution
8:-XX:+PrintGCApplicationStoppedTime
8:-Xloggc:/var/log/elasticsearch/gc.log
8:-XX:+UseGCLogFileRotation
8:-XX:NumberOfGCLogFiles=32
8:-XX:GCLogFileSize=64m
9-:-Xlog:gc*,gc+age=trace,safepoint:file=/var/log/elasticsearch/gc.log:utctime,pid,tags:filecount=32,filesize=64m
9-:-Djava.locale.providers=COMPAT
10-:-XX:UseAVX=2
So increasing heap size didn't help, then I tried to use G1GC instead of CMS just like this:
8:-XX:+UseG1GC
and then also with these:
8:-XX:-UseConcMarkSweepGC
8:-XX:-UseCMSInitiatingOccupancyOnly
8:-XX:+UseG1GC
8:-XX:InitiatingHeapOccupancyPercent=30
8:-XX:G1ReservePercent=25
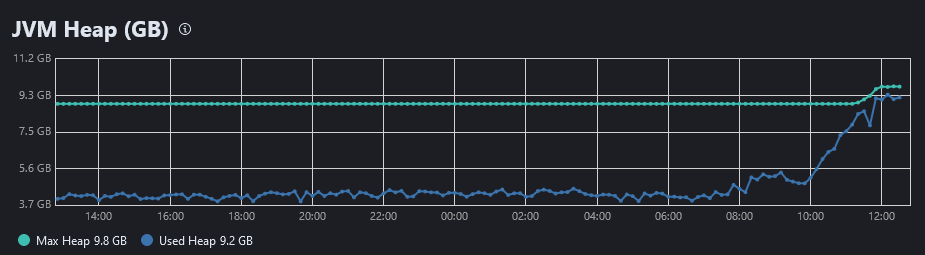
After restarting the node the parent breaker haven't appearead for a few hours or a whole day (I didn't get much further) in the logstash logs, but let me show you some screenshots from Stack Monitoring (with 1 hour period) comparing two hot nodes with the same configuration, first two screenshots are from hot node 1, where the problem doesn't occur:


where you can see, that the heap doesn't get over approx. 7gb and there are none old garbage collections.
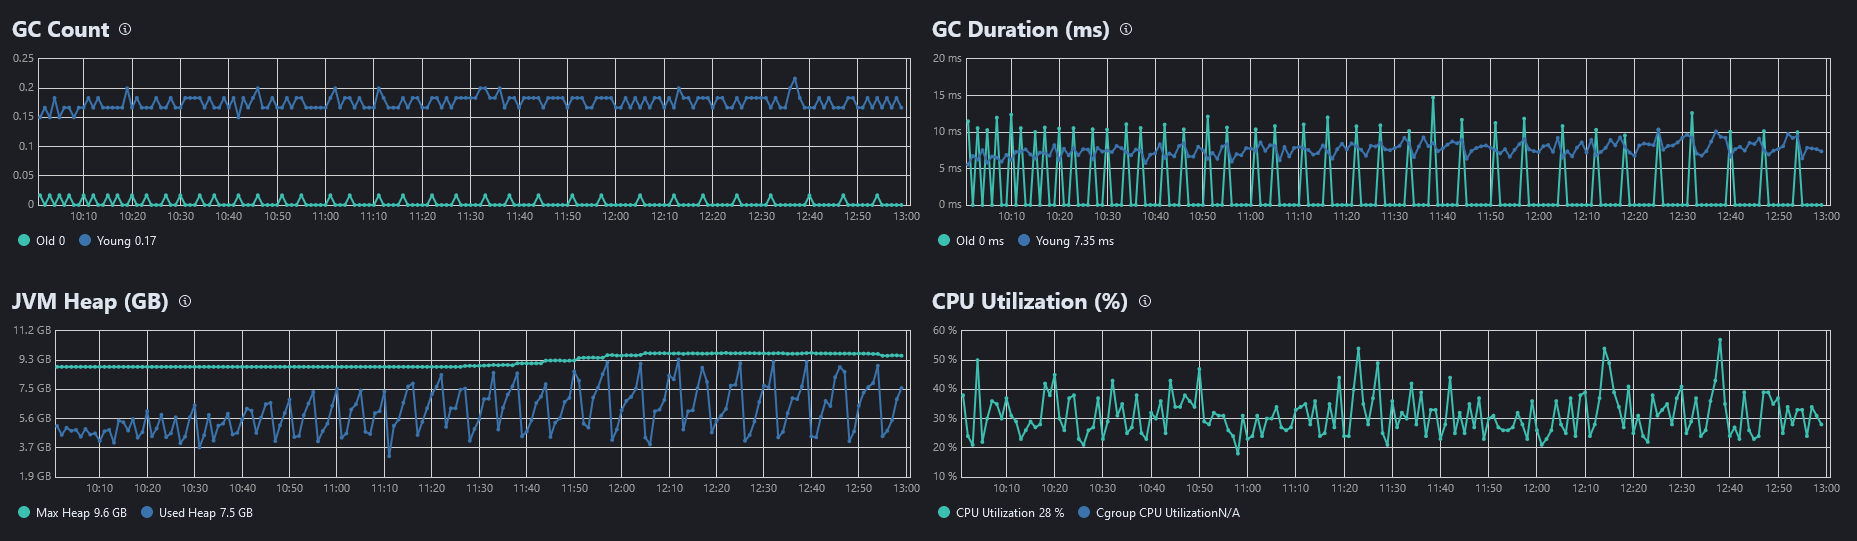
These two screenshots are for the problematic hot node 2, where there are peaks of heap memory and they drop down after GC takes care of some old collections (similar behaviour with CMS and G1GC):

Every 5-8 minutes also comes something like this into elasticsearch logs for the problematic node:
2021-04-21T15:52:27,349][WARN ][o.e.m.j.JvmGcMonitorService] [ELK-D-H-02] [gc][7055] overhead, spent [1.3s] collecting in the last [1.7s]
Another thing that is strange is that max heap for the problematic node changes even when Xms and Xmx is specified - went a bit more stable when i deleted these two settings from jvm.options, so dynamic heap should be used now:

How could I find out what exactly could be causing all this and how to deal with it?
Thanks in advance for any advice.