K8s metricbeat not consistently recognizing metric endpoints

Hello,

I experienced that after restarting metricbeat in kubernetes it recognizes different pods to scan
Recognizes fine after restart:


Only recognizing before:

Only recognizing after:

I have checked that all pods were running during the restart of metricbeat.

If you need any further information/logs please let me know :slight_smile:

Hey @jonas27, welcom to discuss :slight_smile:

Are you using autodiscover? Could you share your configuration?
Do you see anything suspicious in Metricbeat logs?
What version of Metricbeat are you using? In Metricbeat 7.9 there were some fixes for a similar issue.

Thanks @jsoriano :slight_smile:

I am using autodiscovery. I used metricbeat 7.6 but read about the errors and tried 7.8 and now metricbeat:7.9-SNAPSHOT . It didn't work for any version though.

I checked the metricbeat pod for errors and there was nothing suspicious. I was also not able to reproduce which pods are found and which are not found.

My configs are as follows (I removed some company internal things):

---
apiVersion: v1
kind: ConfigMap
metadata:
    name: metricbeat-app-daemonset-config
    namespace: ex-ns
    labels:
        k8s-app: metricbeat-app
data:
  metricbeat.yml: |-
    metricbeat.autodiscover:
      providers:
        - type: kubernetes
          host: ${HOSTNAME}
          templates:
            - condition.equals:
                kubernetes.annotations.prometheus.io.scrape: "true"
              config:
                - module: prometheus
                  period: ${data.kubernetes.annotations.prometheus.io.scrape_interval}
                  # Prometheus exporter host / port
                  hosts: ["${data.host}:${data.kubernetes.annotations.prometheus.io.port}"]
                  metrics_path: ${data.kubernetes.annotations.prometheus.io.path}
                  # processors:
                  # - add_id: ~
                
                
    output.elasticsearch:
      hosts: ['example.com']
    
    # setup.ilm:
    #   "example setup"
---
apiVersion: v1
kind: ConfigMap
metadata:
  name: metricbeat-app-daemonset-modules
  namespace: ex-ns
  labels:
    k8s-app: metricbeat-app
data:
  kubernetes.yml: |-
    - module: kubernetes
      # metricsets:
      period: 90s
      host: ${NODE_NAME}
      hosts: ["https://${NODE_NAME}:10250"]
      enabled: true
      # Token configs excluded
      # processors:
      # - add_id: ~
---
apiVersion: rbac.authorization.k8s.io/v1
kind: ClusterRoleBinding
metadata:
  name: metricbeat-app
subjects:
- kind: ServiceAccount
  name: metricbeat-app
  namespace: ex-ns
roleRef:
  kind: ClusterRole
  name: metricbeat-app
  apiGroup: rbac.authorization.k8s.io
---
apiVersion: rbac.authorization.k8s.io/v1
kind: ClusterRole
metadata:
    name: metricbeat-app
    labels:
        k8s-app: metricbeat-app
rules:
  - apiGroups: [""]
    resources:
    - nodes
    - namespaces
    - events
    - pods
    verbs: ["get", "list", "watch"]
  - apiGroups: ["extensions"]
    resources:
    - replicasets
    verbs: ["get", "list", "watch"]
  - apiGroups: ["apps"]
    resources:
    - statefulsets
    - deployments
    verbs: ["get", "list", "watch"]
  - apiGroups:
    - ""
    resources:
    - nodes/stats
    verbs:
    - get
---
apiVersion: v1
kind: ServiceAccount
metadata:
    name: metricbeat-app
    namespace: ex-ns
    labels:
        k8s-app: metricbeat-app
---
# Deploy a Metricbeat instance per node for node metrics retrieval
apiVersion: apps/v1
kind: DaemonSet
metadata:
  name: metricbeat-app
  namespace: ex-ns
  labels:
    k8s-app: metricbeat-app
spec:
  selector:
    matchLabels:
      k8s-app: metricbeat-app
  template:
    metadata:
      labels:
        k8s-app: metricbeat-app
    spec:
      # tolerations:
      # - key: node-role.kubernetes.io/master
      #   effect: NoSchedule
      serviceAccountName: metricbeat-app
      terminationGracePeriodSeconds: 30
      hostNetwork: true
      dnsPolicy: ClusterFirstWithHostNet
      containers:
      - name: metricbeat
        image: docker.elastic.co/beats/metricbeat:7.9-SNAPSHOT
        args: [
          "-c", "/etc/metricbeat.yml",
          "-e",
        ]
        env:
        - name: ELASTICSEARCH_HOST
          value: example
        - name: ELASTICSEARCH_PORT
          value: "8080"
        - name: NODE_NAME
          valueFrom:
            fieldRef:
              fieldPath: spec.nodeName
        securityContext:
          runAsUser: 0
        resources:
          limits:
            memory: 200Mi
          requests:
            cpu: 100m
            memory: 100Mi
        volumeMounts:
        - name: config
          mountPath: /etc/metricbeat.yml
          readOnly: false
          subPath: metricbeat.yml
        - name: modules
          mountPath: /usr/share/metricbeat/modules.d
      volumes:
      - name: config
        configMap:
          defaultMode: 0600
          name: metricbeat-app-daemonset-config
      - name: modules
        configMap:
          defaultMode: 0600
          name: metricbeat-app-daemonset-modules
      - name: data
        hostPath:
          path: /var/lib/metricbeat-data
          type: DirectoryOrCreate


Configuration looks good, I would only suggest a couple of things:

First, include the annotations you use. Not that I think this is going to make a difference if some pods are being monitored, but just in case.

    metricbeat.autodiscover:
      providers:
        - type: kubernetes
          include_annotations:
            - prometheus.io.scrape
            - prometheus.io.port
          ...

Second, disable cleanup grace period. It waits some seconds after a pod is deleted before stop monitoring it. This is useful with filebeat to ensure that final log lines are collected, but not so much with Metricbeat, that can keep requesting metrics from unavailable pods.

    metricbeat.autodiscover:
      providers:
        - type: kubernetes
          cleanup_timeout: 0
          ...

If issue persist, add autodiscover debug logging, and check in the logs if you see events for the pods that you are missing. You can enable autodiscover debug logging with -d autodiscover. In your config:

        args: [
          "-c", "/etc/metricbeat.yml",
          "-d", "autodiscover",
          "-e",
        ]

I implemented the changes, but our staging cluster is experiencing a lot of deploys atm so I ll verify this on the weekend. Thanks @jsoriano for your help so far :slight_smile:

@jsoriano Sorry, I only got around to get back to this today (I am a student working part time). Anyway, the error is persisting even with the changes.

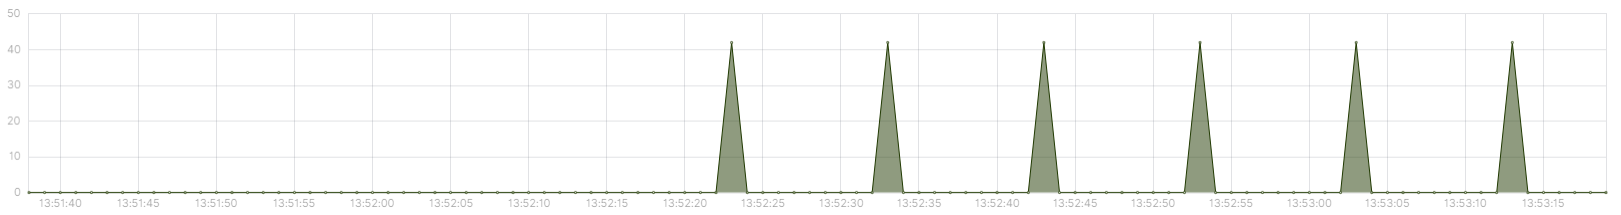
A pod I monitored and has been running for 2 days now, showing the total metric count for the pod (past 15 min, with 2 restarts of metricbeat).

The logs are not really helpful. I filtered for errors and the only ones I got was multiple of

2020-09-03T06:55:41.214Z        ERROR   [autodiscover]  autodiscover/autodiscover.go:209        Auto discover config check failed for config '', won't start runner: string value is not set accessing 'module'

and

2020-09-03T06:55:41.215Z        ERROR   [autodiscover]  autodiscover/autodiscover.go:209        Auto discover config check failed for config '{

But metricbeat always finds some services and as in the example above, restarting the metricbeat pods can help find pods with metrics (or the contrary) without any change to the actual pod.

I can provide the full logs if you want or other infos.
Could there be anything I am missing? (Btw running 7.9.0 now.)

This error is interesting, it indicates that autodiscover is generating some configurations with an incorrect module, but module is clearly set to prometheus in your configuration. Can you try to specify also the collector metricset? It would be like this:

                - module: prometheus
                  metricsets: ['collector']
                  period: ${data.kubernetes.annotations.prometheus.io.scrape_interval}
                  hosts: ["${data.host}:${data.kubernetes.annotations.prometheus.io.port}"]
                  metrics_path: ${data.kubernetes.annotations.prometheus.io.path}

This would show the configuration that it is generating, there we could see why it says that module value is not set. How is the complete config logged by this error?

Full log is

2020-09-03T06:55:41.269Z        ERROR   [autodiscover]  autodiscover/autodiscover.go:209        Auto discover config check failed for config '{
  "metrics_path": "/metrics",
  "module": "prometheus"
}', won't start runner: 1 error: host parsing failed for prometheus-collector: error parsing URL: empty host

I tought some pods just did not specify the correct metric port, thats why I didn't deem it interesting. There was an issue online, where they said metricbeat should fail, if a port is declared as metric port but not as pod port. And the errors seem to occur during discovery, so for individual pods and not during init of metricbeat. And what still confuses me is that after restarting metricbeat for a couple of times it eventually finds a pod, just not consistently. (and reports the correct metrics from it)

Ok, I think that the problem is that the variable ${data.kubernetes.annotations.prometheus.io.port} cannot be resolved. We are introducing a change to improve feedback on these problems: https://github.com/elastic/beats/pull/20898

I think that the annotation is prometheus.io/port, and Beats "dedots" annotations by default, by replacing dots with underscores. The slash should be fine. I think that you would need to use this variable like this:

${data.kubernetes.annotations.prometheus_io/port}

In the debug logs you can probably see some autodiscover events, check there how this annotation is being processed.

I will try it out thanks!

But what surprises me is the randomness with which it works. Sometimes the pod is found and sometimes not...

In the latest docs it still says to use

kubernetes.annotations.prometheus.io/scrape: "true"

Is this incorrect as well?

https://www.elastic.co/guide/en/beats/metricbeat/current/configuration-autodiscover.html

Yes, this would be something to investigate, if the problem is on the variable name used in the template, it should always fail.

Umm, it could be, yes. Could you confirm if it works for you with these two variants?

  • ${data.kubernetes.annotations.prometheus_io/port}
  • ${data.kubernetes.annotations.prometheus.io/port}

So far I can not find anything explaining the randomness. Testing a lot of configs in our staging cluster is hard as it would require the devs to change the pod annotations each time as well.

Testing with my own pods, I can say that the uri is always found if it matches (ie config and real annotation are the same.

What I can say is that using prometheus_io is not an option as it is an invalid annotation declaration:

The DaemonSet "test-metricbeat-app-longterm" is invalid: 
spec.template.annotations: Invalid value: "prometheus_io/scrape_longterm": 
prefix part a DNS-1123 subdomain must consist of lower case alphanumeric characters, '-' or '.', and must start and end with an alphanumeric character 
(e.g. 'example.com', regex used for validation is '[a-z0-9]([-a-z0-9]*[a-z0-9])?(\.[a-z0-9]([-a-z0-9]*[a-z0-9])?)*')

*Inserted line breaks for better readability

@jsoriano Could it be that not using the co.elastic.metrics/module: prometheus annotation is at fault here? I do set it later in the configs but it could be some sort of race condition, where it expects the module before the processing is done but because of using go routines (or similar) this is not the case.

And after changing to these annotations:

apiVersion: v1
kind: ConfigMap
metadata:
    name: metricbeat-app-daemonset-config
    namespace: ex
    labels:
        k8s-app: metricbeat-app
data:
  metricbeat.yml: |-
    metricbeat.autodiscover:
      providers:
        - type: kubernetes
          cleanup_timeout: 0
          include_annotations:
            - prometheus.io/path
            - prometheus.io/port
            - prometheus.io/scrape
            - prometheus.io/scrape_interval
          host: ${HOSTNAME}
          templates:
            - condition.equals:
                kubernetes.annotations.prometheus.io/scrape: "true"
              config:
                - module: prometheus
                  hosts: ["${data.host}:${data.kubernetes.annotations.prometheus.io/port}"]
                  metrics_path: ${data.kubernetes.annotations.prometheus.io/path}
                  period: ${data.kubernetes.annotations.prometheus.io/scrape_interval}

I still get this (only metricbeat pod restarts, no config changes)

The usual error is still

2020-09-24T08:17:24.277Z	DEBUG	[autodiscover]	autodiscover/autodiscover.go:195	Generated config: {
  "metrics_path": "/metrics"
}
2020-09-24T08:17:24.277Z	DEBUG	[autodiscover]	autodiscover/autodiscover.go:259	Got a meta field in the event
2020-09-24T08:17:24.277Z	ERROR	[autodiscover]	autodiscover/autodiscover.go:209	Auto discover config check failed for config '{
  "metrics_path": "/metrics"
}', won't start runner: string value is not set accessing 'module'

I realized that metricbeat does not default to a period, or sometimes fails to do so.
What I mean is this:
Specifying a period in the main config works, and in the processor config you can specify a new one. If the pod then does not specify a period, metricbeat sometimes uses the default, but sometimes also just fails.

This is a weird behavior and should be investigated further. Also it would be nice to have "defaults" in under provider and then optional overwrites in the templates configs.

This topic was automatically closed 28 days after the last reply. New replies are no longer allowed.