I'm seeing poor performance with the Kafka output plugin when I increase the linger_ms and batch_size settings. This is the opposite behavior I would expect after reading the Kafka producer documentation. Increasing batch sizes should improve throughput, not reduce it! I have not seen this issue with other Kafka producer implementations, so it seems like an issue specific to Logstash.
My pipeline is very simple - read TCP input, apply no filters, then send to Kafka output. Other notable settings are:
persistent queue feature enabled
8 worker threads
running on VM with 4 CPUs, 8GB RAM
Here are some sample results of just tweaking the linger_ms setting:
linger_ms=250
batch_size=65536 output events per second=14000
linger_ms=10000
batch_size=65536 output events per second=1200
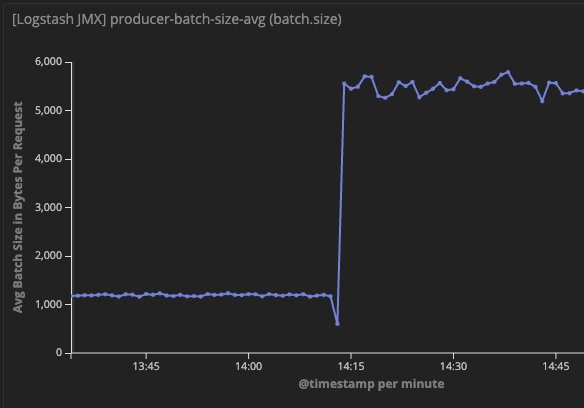
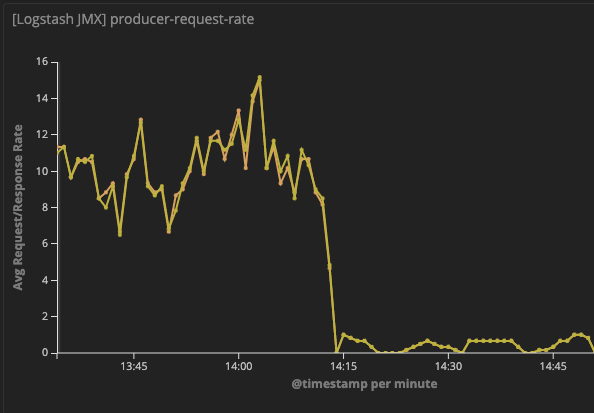
I have enabled JMX metrics on my logstash instance to look at the Kafka producer statistics. From this I can see that increasing linger_ms does result in larger sized batches being sent to Kafka, and that records queue for linger_ms amount of time before being sent. But still, the performance is greatly reduced despite improved batching.
How can I find the bottleneck for this pipeline? Are there known issues with the Kafka output plugin?
Your batch_size is 65536, but the actual batch sizes shown in JMX are around 6,000, so events are going to be delayed by 10 seconds, lingering to see if the batch can be filled. I would think the bottleneck for the pipeline is the amount of time the events linger!
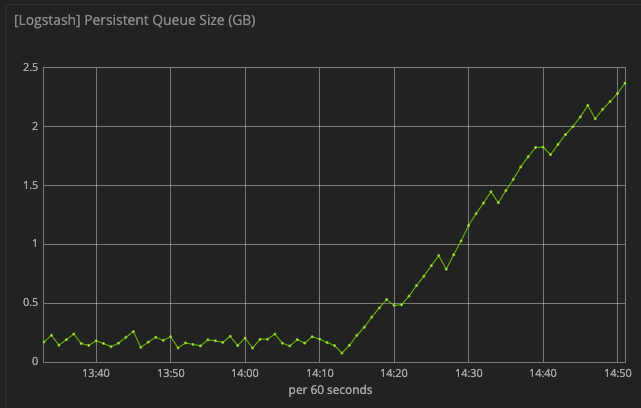
Thanks for the response. I would agree except that my persistent queue is filling up all this time meaning it is falling behind, so the batches should be much more full than they actually are.
It seems to me like the bottleneck is between pulling the data from the persistent queue and putting it into the producer batches. I'm trying to understand how this could be the case though - the disk doesn't seem too busy and the Kafka cluster I'm pushing to is supporting other producers with much higher events per second than this example.
I got massively improved performance by setting pipeline.batch.size to a much higher value like 10000-20000 as well as turning off the persistent queue. I also set pipeline.batch.delay to 10000 to force larger batches. With persistent queue enabled the performance is about 80% worse, even though iostat made it seem like the disk wasn't fully utilized.
The value for pipeline.batch.size seems very high high but so far it is giving me the best throughput in the load tests. There is a warning at startup about too many maximum inflight events, but so far I don't have OOM errors on a 6GB JVM.
From all this, it seems to me like the TCP listener was not able to keep up with the input load very well due to the smaller batch size, and the disk or however Logstash uses the persistent queue is also a limiting factor. I was using Logstash 6.8.3 so maybe a newer version would help.
Further updates... increasing pipeline.workers to a higher value has improved performance of the part of the pipeline between the persistent queue and the Kafka producer, resulting in larger and more frequent batches.
Apache, Apache Lucene, Apache Hadoop, Hadoop, HDFS and the yellow elephant
logo are trademarks of the
Apache Software Foundation
in the United States and/or other countries.