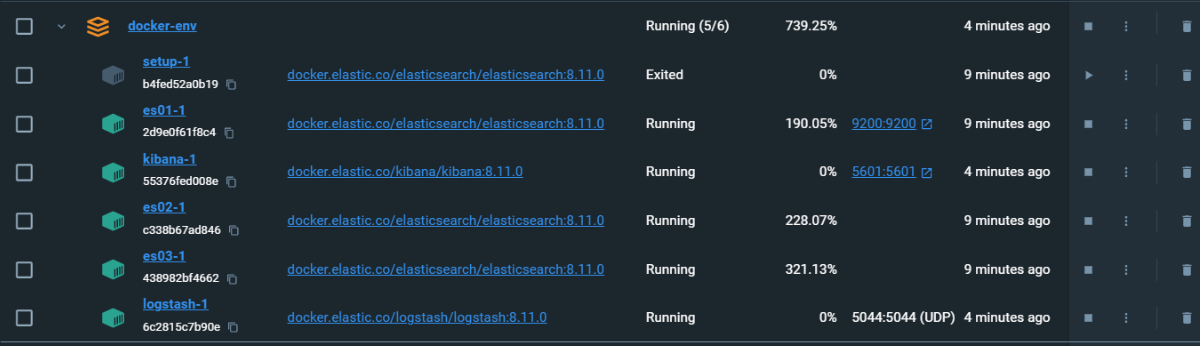
Caught a new error. es01 just crashed after running normally, 19mins aft docker-compose up
Seems to me got this issue on master node not elected all of a sudden
2023-11-12 00:44:42 {"@timestamp":"2023-11-11T16:44:42.654Z", "log.level": "INFO", "message":"publish_address {172.24.0.3:9300}, bound_addresses {0.0.0.0:9300}", "ecs.version": "1.2.0","service.name":"ES_ECS","event.dataset":"elasticsearch.server","process.thread.name":"main","log.logger":"org.elasticsearch.transport.TransportService","elasticsearch.node.name":"es01","elasticsearch.cluster.name":"docker-cluster"}
2023-11-12 00:44:51 {"@timestamp":"2023-11-11T16:44:51.606Z", "log.level": "INFO", "message":"bound or publishing to a non-loopback address, enforcing bootstrap checks", "ecs.version": "1.2.0","service.name":"ES_ECS","event.dataset":"elasticsearch.server","process.thread.name":"main","log.logger":"org.elasticsearch.bootstrap.BootstrapChecks","elasticsearch.node.name":"es01","elasticsearch.cluster.name":"docker-cluster"}
2023-11-12 00:44:52 {"@timestamp":"2023-11-11T16:44:52.604Z", "log.level": "WARN", "message":"this node is locked into cluster UUID [3m-f4WNRREeLwEQNJDIbbQ] but [cluster.initial_master_nodes] is set to [es01, es02, es03]; remove this setting to avoid possible data loss caused by subsequent cluster bootstrap attempts; for further information see https://www.elastic.co/guide/en/elasticsearch/reference/8.11/important-settings.html#initial_master_nodes", "ecs.version": "1.2.0","service.name":"ES_ECS","event.dataset":"elasticsearch.server","process.thread.name":"main","log.logger":"org.elasticsearch.cluster.coordination.ClusterBootstrapService","elasticsearch.node.name":"es01","elasticsearch.cluster.name":"docker-cluster"}
2023-11-12 00:45:04 {"@timestamp":"2023-11-11T16:45:04.535Z", "log.level": "WARN", "message":"master not discovered or elected yet, an election requires at least 2 nodes with ids from [TMQPiSCqQeSMOiDsX_C5MQ, aSKFSYSvR96IAjii9hFj4w, -JiMNlfRSOi4PBvbLV7urg], have only discovered non-quorum [{es01}{TMQPiSCqQeSMOiDsX_C5MQ}{v3QZ1N1fTx25h2OFHSUw2w}{es01}{172.24.0.3}{172.24.0.3:9300}{cdfhilmrstw}{8.11.0}{7000099-8500003}]; discovery will continue using [172.24.0.4:9300, 172.24.0.5:9300] from hosts providers and [{es01}{TMQPiSCqQeSMOiDsX_C5MQ}{v3QZ1N1fTx25h2OFHSUw2w}{es01}{172.24.0.3}{172.24.0.3:9300}{cdfhilmrstw}{8.11.0}{7000099-8500003}] from last-known cluster state; node term 30, last-accepted version 674 in term 30; for troubleshooting guidance, see https://www.elastic.co/guide/en/elasticsearch/reference/8.11/discovery-troubleshooting.html", "ecs.version": "1.2.0","service.name":"ES_ECS","event.dataset":"elasticsearch.server","process.thread.name":"elasticsearch[es01][cluster_coordination][T#1]","log.logger":"org.elasticsearch.cluster.coordination.ClusterFormationFailureHelper","elasticsearch.node.name":"es01","elasticsearch.cluster.name":"docker-cluster"}
2023-11-12 00:45:15 {"@timestamp":"2023-11-11T16:45:15.116Z", "log.level": "WARN", "message":"master not discovered or elected yet, an election requires at least 2 nodes with ids from [TMQPiSCqQeSMOiDsX_C5MQ, aSKFSYSvR96IAjii9hFj4w, -JiMNlfRSOi4PBvbLV7urg], have discovered possible quorum [{es01}{TMQPiSCqQeSMOiDsX_C5MQ}{v3QZ1N1fTx25h2OFHSUw2w}{es01}{172.24.0.3}{172.24.0.3:9300}{cdfhilmrstw}{8.11.0}{7000099-8500003}, {es03}{aSKFSYSvR96IAjii9hFj4w}{WI2nEshdQUuCUF4IeNDDaw}{es03}{172.24.0.5}{172.24.0.5:9300}{cdfhilmrstw}{8.11.0}{7000099-8500003}, {es02}{-JiMNlfRSOi4PBvbLV7urg}{8_BTC3N5TTO5CfNkJqSzFw}{es02}{172.24.0.4}{172.24.0.4:9300}{cdfhilmrstw}{8.11.0}{7000099-8500003}]; discovery will continue using [172.24.0.4:9300, 172.24.0.5:9300] from hosts providers and [{es01}{TMQPiSCqQeSMOiDsX_C5MQ}{v3QZ1N1fTx25h2OFHSUw2w}{es01}{172.24.0.3}{172.24.0.3:9300}{cdfhilmrstw}{8.11.0}{7000099-8500003}] from last-known cluster state; node term 32, last-accepted version 674 in term 30; joining [{es03}{aSKFSYSvR96IAjii9hFj4w}{WI2nEshdQUuCUF4IeNDDaw}{es03}{172.24.0.5}{172.24.0.5:9300}{cdfhilmrstw}{8.11.0}{7000099-8500003}] in term [32] has status [waiting for response] after [6s/6069ms]; for troubleshooting guidance, see https://www.elastic.co/guide/en/elasticsearch/reference/8.11/discovery-troubleshooting.html", "ecs.version": "1.2.0","service.name":"ES_ECS","event.dataset":"elasticsearch.server","process.thread.name":"elasticsearch[es01][cluster_coordination][T#1]","log.logger":"org.elasticsearch.cluster.coordination.ClusterFormationFailureHelper","elasticsearch.node.name":"es01","elasticsearch.cluster.name":"docker-cluster"}
2023-11-12 00:45:19 {"@timestamp":"2023-11-11T16:45:19.174Z", "log.level": "INFO", "message":"master node changed {previous [], current [{es03}{aSKFSYSvR96IAjii9hFj4w}{WI2nEshdQUuCUF4IeNDDaw}{es03}{172.24.0.5}{172.24.0.5:9300}{cdfhilmrstw}{8.11.0}{7000099-8500003}]}, added {{es03}{aSKFSYSvR96IAjii9hFj4w}{WI2nEshdQUuCUF4IeNDDaw}{es03}{172.24.0.5}{172.24.0.5:9300}{cdfhilmrstw}{8.11.0}{7000099-8500003}, {es02}{-JiMNlfRSOi4PBvbLV7urg}{8_BTC3N5TTO5CfNkJqSzFw}{es02}{172.24.0.4}{172.24.0.4:9300}{cdfhilmrstw}{8.11.0}{7000099-8500003}}, term: 32, version: 695, reason: ApplyCommitRequest{term=32, version=695, sourceNode={es03}{aSKFSYSvR96IAjii9hFj4w}{WI2nEshdQUuCUF4IeNDDaw}{es03}{172.24.0.5}{172.24.0.5:9300}{cdfhilmrstw}{8.11.0}{7000099-8500003}{ml.allocated_processors_double=8.0, ml.allocated_processors=8, ml.machine_memory=4294967296, xpack.installed=true, transform.config_version=10.0.0, ml.config_version=11.0.0, ml.max_jvm_size=2147483648}}", "ecs.version": "1.2.0","service.name":"ES_ECS","event.dataset":"elasticsearch.server","process.thread.name":"elasticsearch[es01][clusterApplierService#updateTask][T#1]","log.logger":"org.elasticsearch.cluster.service.ClusterApplierService","elasticsearch.node.name":"es01","elasticsearch.cluster.name":"docker-cluster"}
2023-11-12 00:45:22 {"@timestamp":"2023-11-11T16:45:22.154Z", "log.level": "INFO", "message":"retrying master election after [10] failed attempts; election attempts are currently scheduled up to [1100ms] apart", "ecs.version":
2023-11-12 00:45:29 {"@timestamp":"2023-11-11T16:45:29.313Z", "log.level": "INFO", "message":"license [4a2d1b11-2c62-4962-834d-5090a8f205dc] mode [basic] - valid", "ecs.version": "1.2.0","service.name":"ES_ECS","event.dataset":"elasticsearch.server","process.thread.name":"elasticsearch[es01][clusterApplierService#updateTask][T#1]","log.logger":"org.elasticsearch.license.ClusterStateLicenseService","elasticsearch.node.name":"es01","elasticsearch.cluster.name":"docker-cluster"}
2023-11-12 00:45:29 {"@timestamp":"2023-11-11T16:45:29.335Z", "log.level": "INFO", "message":"license mode is [basic], currently licensed security realms are [reserved/reserved,file/default_file,native/default_native]", "ecs.version": "1.2.0","service.name":"ES_ECS","event.dataset":"elasticsearch.server","process.thread.name":"elasticsearch[es01][clusterApplierService#updateTask][T#1]","log.logger":"org.elasticsearch.xpack.security.authc.Realms","elasticsearch.node.name":"es01","elasticsearch.cluster.name":"docker-cluster"}
2023-11-12 00:45:57 {"@timestamp":"2023-11-11T16:45:57.640Z", "log.level": "INFO", "message":"reloading search analyzers", "ecs.version": "1.2.0","service.name":"ES_ECS","event.dataset":"elasticsearch.server","process.thread.name":"elasticsearch[es01][generic][T#1]","log.logger":"org.elasticsearch.index.mapper.MapperService","elasticsearch.cluster.uuid":"3m-f4WNRREeLwEQNJDIbbQ","elasticsearch.node.id":"TMQPiSCqQeSMOiDsX_C5MQ","elasticsearch.node.name":"es01","elasticsearch.cluster.name":"docker-cluster","tags":[" [.slo-observability.sli-v2]"]}
2023-11-12 00:45:59 {"@timestamp":"2023-11-11T16:45:59.462Z", "log.level": "INFO", "message":"reloading search analyzers", "ecs.version": "1.2.0","service.name":"ES_ECS","event.dataset":"elasticsearch.server","process.thread.name":"elasticsearch[es01][generic][T#4]","log.logger":"org.elasticsearch.index.mapper.MapperService","elasticsearch.cluster.uuid":"3m-f4WNRREeLwEQNJDIbbQ","elasticsearch.node.id":"TMQPiSCqQeSMOiDsX_C5MQ","elasticsearch.node.name":"es01","elasticsearch.cluster.name":"docker-cluster","tags":[" [.kibana-observability-ai-assistant-conversations-000001]"]}
2023-11-12 00:45:59 {"@timestamp":"2023-11-11T16:45:59.520Z", "log.level": "INFO", "message":"reloading search analyzers", "ecs.version": "1.2.0","service.name":"ES_ECS","event.dataset":"elasticsearch.server","process.thread.name":"elasticsearch[es01][generic][T#2]","log.logger":"org.elasticsearch.index.mapper.MapperService","elasticsearch.cluster.uuid":"3m-f4WNRREeLwEQNJDIbbQ","elasticsearch.node.id":"TMQPiSCqQeSMOiDsX_C5MQ","elasticsearch.node.name":"es01","elasticsearch.cluster.name":"docker-cluster","tags":[" [.kibana-observability-ai-assistant-kb-000001]"]}
2023-11-12 00:46:03 {"@timestamp":"2023-11-11T16:46:03.205Z", "log.level": "WARN", "message":"[gc][young][77][11] duration [1.1s], collections [1]/[1.5s], total [1.1s]/[2.6s], memory [462.9mb]->[106.4mb]/[2gb], all_pools {[young] [388mb]->[0b]/[0b]}{[old] [58.4mb]->[58.4mb]/[2gb]}{[survivor] [16.4mb]->[47.9mb]/[0b]}", "ecs.version": "1.2.0","service.name":"ES_ECS","event.dataset":"elasticsearch.server","process.thread.name":"elasticsearch[es01][scheduler][T#1]","log.logger":"org.elasticsearch.monitor.jvm.JvmGcMonitorService","elasticsearch.cluster.uuid":"3m-f4WNRREeLwEQNJDIbbQ","elasticsearch.node.id":"TMQPiSCqQeSMOiDsX_C5MQ","elasticsearch.node.name":"es01","elasticsearch.cluster.name":"docker-cluster"}
2023-11-12 00:46:03 {"@timestamp":"2023-11-11T16:46:03.269Z", "log.level": "WARN", "message":"[gc][77] overhead, spent [1.1s] collecting in the last [1.5s]", "ecs.version": "1.2.0","service.name":"ES_ECS","event.dataset":"elasticsearch.server","process.thread.name":"elasticsearch[es01][scheduler][T#1]","log.logger":"org.elasticsearch.monitor.jvm.JvmGcMonitorService","elasticsearch.cluster.uuid":"3m-f4WNRREeLwEQNJDIbbQ","elasticsearch.node.id":"TMQPiSCqQeSMOiDsX_C5MQ","elasticsearch.node.name":"es01","elasticsearch.cluster.name":"docker-cluster"}
2023-11-12 00:46:07 {"@timestamp":"2023-11-11T16:46:07.548Z", "log.level": "WARN", "message":"received plaintext http traffic on an https channel, closing connection Netty4HttpChannel{localAddress=/172.24.0.3:9200, remoteAddress=/172.24.0.1:40258}", "ecs.version": "1.2.0","service.name":"ES_ECS","event.dataset":"elasticsearch.server","process.thread.name":"elasticsearch[es01][transport_worker][T#8]","log.logger":"org.elasticsearch.http.netty4.Netty4HttpServerTransport","elasticsearch.cluster.uuid":"3m-f4WNRREeLwEQNJDIbbQ","elasticsearch.node.id":"TMQPiSCqQeSMOiDsX_C5MQ","elasticsearch.node.name":"es01","elasticsearch.cluster.name":"docker-cluster"}
2023-11-12 00:46:07 {"@timestamp":"2023-11-11T16:46:07.615Z", "log.level": "WARN", "message":"received plaintext http traffic on an https channel, closing connection Netty4HttpChannel{localAddress=/172.24.0.3:9200, remoteAddress=/172.24.0.1:40264}", "ecs.version": "1.2.0","service.name":"ES_ECS","event.dataset":"elasticsearch.server","process.thread.name":"elasticsearch[es01][transport_worker][T#1]","log.logger":"org.elasticsearch.http.netty4.Netty4HttpServerTransport","elasticsearch.cluster.uuid":"3m-f4WNRREeLwEQNJDIbbQ","elasticsearch.node.id":"TMQPiSCqQeSMOiDsX_C5MQ","elasticsearch.node.name":"es01","elasticsearch.cluster.name":"docker-cluster"}
2023-11-12 00:46:09 {"@timestamp":"2023-11-11T16:46:09.018Z", "log.level": "WARN", "message":"received plaintext http traffic on an https channel, closing connection Netty4HttpChannel{localAddress=/172.24.0.3:9200, remoteAddress=/172.24.0.1:40270}", "ecs.version": "1.2.0","service.name":"ES_ECS","event.dataset":"elasticsearch.server","process.thread.name":"elasticsearch[es01][transport_worker][T#2]","log.logger":"org.elasticsearch.http.netty4.Netty4HttpServerTransport","elasticsearch.cluster.uuid":"3m-f4WNRREeLwEQNJDIbbQ","elasticsearch.node.id":"TMQPiSCqQeSMOiDsX_C5MQ","elasticsearch.node.name":"es01","elasticsearch.cluster.name":"docker-cluster"}
2023-11-12 00:46:09 {"@timestamp":"2023-11-11T16:46:09.029Z", "log.level": "WARN", "message":"received plaintext http traffic on an https channel, closing connection Netty4HttpChannel{localAddress=/172.24.0.3:9200, remoteAddress=/172.24.0.1:40272}", "ecs.version": "1.2.0","service.name":"ES_ECS","event.dataset":"elasticsearch.server","process.thread.name":"elasticsearch[es01][transport_worker][T#3]","log.logger":"org.elasticsearch.http.netty4.Netty4HttpServerTransport","elasticsearch.cluster.uuid":"3m-f4WNRREeLwEQNJDIbbQ","elasticsearch.node.id":"TMQPiSCqQeSMOiDsX_C5MQ","elasticsearch.node.name":"es01","elasticsearch.cluster.name":"docker-cluster"}
2023-11-12 00:46:09 {"@timestamp":"2023-11-11T16:46:09.088Z", "log.level": "WARN", "message":"received plaintext http traffic on an https channel, closing connection Netty4HttpChannel{localAddress=/172.24.0.3:9200, remoteAddress=/172.24.0.1:40276}", "ecs.version": "1.2.0","service.name":"ES_ECS","event.dataset":"elasticsearch.server","process.thread.name":"elasticsearch[es01][transport_worker][T#4]","log.logger":"org.elasticsearch.http.netty4.Netty4HttpServerTransport","elasticsearch.cluster.uuid":"3m-f4WNRREeLwEQNJDIbbQ","elasticsearch.node.id":"TMQPiSCqQeSMOiDsX_C5MQ","elasticsearch.node.name":"es01","elasticsearch.cluster.name":"docker-cluster"}
2023-11-12 00:46:15 {"@timestamp":"2023-11-11T16:46:15.214Z", "log.level": "WARN", "message":"received plaintext http traffic on an https channel, closing connection Netty4HttpChannel{localAddress=/172.24.0.3:9200, remoteAddress=/172.24.0.1:40284}", "ecs.version": "1.2.0","service.name":"ES_ECS","event.dataset":"elasticsearch.server","process.thread.name":"elasticsearch[es01][transport_worker][T#5]","log.logger":"org.elasticsearch.http.netty4.Netty4HttpServerTransport","elasticsearch.cluster.uuid":"3m-f4WNRREeLwEQNJDIbbQ","elasticsearch.node.id":"TMQPiSCqQeSMOiDsX_C5MQ","elasticsearch.node.name":"es01","elasticsearch.cluster.name":"docker-cluster"}
2023-11-12 00:46:15 {"@timestamp":"2023-11-11T16:46:15.214Z", "log.level": "WARN", "message":"received plaintext http traffic on an https channel, closing connection Netty4HttpChannel{localAddress=/172.24.0.3:9200, remoteAddress=/172.24.0.1:40286}", "ecs.version": "1.2.0","service.name":"ES_ECS","event.dataset":"elasticsearch.server","process.thread.name":"elasticsearch[es01][transport_worker][T#6]","log.logger":"org.elasticsearch.http.netty4.Netty4HttpServerTransport","elasticsearch.cluster.uuid":"3m-f4WNRREeLwEQNJDIbbQ","elasticsearch.node.id":"TMQPiSCqQeSMOiDsX_C5MQ","elasticsearch.node.name":"es01","elasticsearch.cluster.name":"docker-cluster"}
2023-11-12 00:46:15 {"@timestamp":"2023-11-11T16:46:15.214Z", "log.level": "WARN", "message":"received plaintext http traffic on an https channel, closing connection Netty4HttpChannel{localAddress=/172.24.0.3:9200, remoteAddress=/172.24.0.1:40290}", "ecs.version": "1.2.0","service.name":"ES_ECS","event.dataset":"elasticsearch.server","process.thread.name":"elasticsearch[es01][transport_worker][T#7]","log.logger":"org.elasticsearch.http.netty4.Netty4HttpServerTransport","elasticsearch.cluster.uuid":"3m-f4WNRREeLwEQNJDIbbQ","elasticsearch.node.id":"TMQPiSCqQeSMOiDsX_C5MQ","elasticsearch.node.name":"es01","elasticsearch.cluster.name":"docker-cluster"}
2023-11-12 00:46:21 {"@timestamp":"2023-11-11T16:46:21.057Z", "log.level": "WARN", "message":"http client did not trust this server's certificate, closing connection Netty4HttpChannel{localAddress=/172.24.0.3:9200, remoteAddress=/172.24.0.1:40306}", "ecs.version": "1.2.0","service.name":"ES_ECS","event.dataset":"elasticsearch.server","process.thread.name":"elasticsearch[es01][transport_worker][T#2]","log.logger":"org.elasticsearch.http.netty4.Netty4HttpServerTransport","elasticsearch.cluster.uuid":"3m-f4WNRREeLwEQNJDIbbQ","elasticsearch.node.id":"TMQPiSCqQeSMOiDsX_C5MQ","elasticsearch.node.name":"es01","elasticsearch.cluster.name":"docker-cluster"}
2023-11-12 00:46:21 {"@timestamp":"2023-11-11T16:46:21.057Z", "log.level": "WARN", "message":"http client did not trust this server's certificate, closing connection Netty4HttpChannel{localAddress=/172.24.0.3:9200, remoteAddress=/172.24.0.1:40304}", "ecs.version": "1.2.0","service.name":"ES_ECS","event.dataset":"elasticsearch.server","process.thread.name":"elasticsearch[es01][transport_worker][T#1]","log.logger":"org.elasticsearch.http.netty4.Netty4HttpServerTransport","elasticsearch.cluster.uuid":"3m-f4WNRREeLwEQNJDIbbQ","elasticsearch.node.id":"TMQPiSCqQeSMOiDsX_C5MQ","elasticsearch.node.name":"es01","elasticsearch.cluster.name":"docker-cluster"}
2023-11-12 00:46:21 {"@timestamp":"2023-11-11T16:46:21.844Z", "log.level": "INFO", "message":"reloading search analyzers", "ecs.version": "1.2.0","service.name":"ES_ECS","event.dataset":"elasticsearch.server","process.thread.name":"elasticsearch[es01][generic][T#1]","log.logger":"org.elasticsearch.index.mapper.MapperService","elasticsearch.cluster.uuid":"3m-f4WNRREeLwEQNJDIbbQ","elasticsearch.node.id":"TMQPiSCqQeSMOiDsX_C5MQ","elasticsearch.node.name":"es01","elasticsearch.cluster.name":"docker-cluster","tags":[" [.kibana_alerting_cases_8.11.0_001]"]}
2023-11-12 00:46:22 {"@timestamp":"2023-11-11T16:46:22.570Z", "log.level": "INFO", "message":"reloading search analyzers", "ecs.version": "1.2.0","service.name":"ES_ECS","event.dataset":"elasticsearch.server","process.thread.name":"elasticsearch[es01][generic][T#2]","log.logger":"org.elasticsearch.index.mapper.MapperService","elasticsearch.cluster.uuid":"3m-f4WNRREeLwEQNJDIbbQ","elasticsearch.node.id":"TMQPiSCqQeSMOiDsX_C5MQ","elasticsearch.node.name":"es01","elasticsearch.cluster.name":"docker-cluster","tags":[" [.security-7]"]}
2023-11-12 00:46:44 {"@timestamp":"2023-11-11T16:46:44.162Z", "log.level": "WARN", "message":"[gc][young][113][12] duration [1.7s], collections [1]/[2.3s], total [1.7s]/[4.4s], memory [158.4mb]->[114.4mb]/[2gb], all_pools {[young] [44mb]->[0b]/[0b]}{[old] [66.4mb]->[108.5mb]/[2gb]}{[survivor] [47.9mb]->[5.9mb]/[0b]}", "ecs.version": "1.2.0","service.name":"ES_ECS","event.dataset":"elasticsearch.server","process.thread.name":"elasticsearch[es01][scheduler][T#1]","log.logger":"org.elasticsearch.monitor.jvm.JvmGcMonitorService","elasticsearch.cluster.uuid":"3m-f4WNRREeLwEQNJDIbbQ","elasticsearch.node.id":"TMQPiSCqQeSMOiDsX_C5MQ","elasticsearch.node.name":"es01","elasticsearch.cluster.name":"docker-cluster"}
2023-11-12 00:46:44 {"@timestamp":"2023-11-11T16:46:44.434Z", "log.level": "WARN", "message":"[gc][113] overhead, spent [1.7s] collecting in the last [2.3s]", "ecs.version": "1.2.0","service.name":"ES_ECS","event.dataset":"elasticsearch.server","process.thread.name":"elasticsearch[es01][scheduler][T#1]","log.logger":"org.elasticsearch.monitor.jvm.JvmGcMonitorService","elasticsearch.cluster.uuid":"3m-f4WNRREeLwEQNJDIbbQ","elasticsearch.node.id":"TMQPiSCqQeSMOiDsX_C5MQ","elasticsearch.node.name":"es01","elasticsearch.cluster.name":"docker-cluster"}
2023-11-12 00:46:58 {"@timestamp":"2023-11-11T16:46:57.957Z", "log.level": "INFO", "message":"reloading search analyzers", "ecs.version": "1.2.0","service.name":"ES_ECS","event.dataset":"elasticsearch.server","process.thread.name":"elasticsearch[es01][generic][T#5]","log.logger":"org.elasticsearch.index.mapper.MapperService","elasticsearch.cluster.uuid":"3m-f4WNRREeLwEQNJDIbbQ","elasticsearch.node.id":"TMQPiSCqQeSMOiDsX_C5MQ","elasticsearch.node.name":"es01","elasticsearch.cluster.name":"docker-cluster","tags":[" [.kibana_security_solution_8.11.0_001]"]}
2023-11-12 00:46:58 {"@timestamp":"2023-11-11T16:46:58.142Z", "log.level": "INFO", "message":"reloading search analyzers", "ecs.version": "1.2.0","service.name":"ES_ECS","event.dataset":"elasticsearch.server","process.thread.name":"elasticsearch[es01][generic][T#4]","log.logger":"org.elasticsearch.index.mapper.MapperService","elasticsearch.cluster.uuid":"3m-f4WNRREeLwEQNJDIbbQ","elasticsearch.node.id":"TMQPiSCqQeSMOiDsX_C5MQ","elasticsearch.node.name":"es01","elasticsearch.cluster.name":"docker-cluster","tags":[" [.kibana_8.11.0_001]"]}
2023-11-12 00:47:22 {"@timestamp":"2023-11-11T16:47:22.824Z", "log.level": "WARN", "message":"handling request [InboundMessage{Header{772}{8512001}{947}{true}{false}{false}{false}{indices:data/read/search[phase/query]}}] took [5308ms] which is above the warn threshold of [5000ms]", "ecs.version": "1.2.0","service.name":"ES_ECS","event.dataset":"elasticsearch.server","process.thread.name":"elasticsearch[es01][transport_worker][T#2]","log.logger":"org.elasticsearch.transport.InboundHandler","elasticsearch.cluster.uuid":"3m-f4WNRREeLwEQNJDIbbQ","elasticsearch.node.id":"TMQPiSCqQeSMOiDsX_C5MQ","elasticsearch.node.name":"es01","elasticsearch.cluster.name":"docker-cluster"}
2023-11-12 00:47:23 {"@timestamp":"2023-11-11T16:47:23.506Z", "log.level": "INFO", "message":"reloading search analyzers", "ecs.version": "1.2.0","service.name":"ES_ECS","event.dataset":"elasticsearch.server","process.thread.name":"elasticsearch[es01][generic][T#6]","log.logger":"org.elasticsearch.index.mapper.MapperService","elasticsearch.cluster.uuid":"3m-f4WNRREeLwEQNJDIbbQ","elasticsearch.node.id":"TMQPiSCqQeSMOiDsX_C5MQ","elasticsearch.node.name":"es01","elasticsearch.cluster.name":"docker-cluster","tags":[" [.kibana_task_manager_8.11.0_001]"]}
2023-11-12 00:47:24 {"@timestamp":"2023-11-11T16:47:24.350Z", "log.level": "INFO", "message":"reloading search analyzers", "ecs.version": "1.2.0","service.name":"ES_ECS","event.dataset":"elasticsearch.server","process.thread.name":"elasticsearch[es01][generic][T#3]","log.logger":"org.elasticsearch.index.mapper.MapperService","elasticsearch.cluster.uuid":"3m-f4WNRREeLwEQNJDIbbQ","elasticsearch.node.id":"TMQPiSCqQeSMOiDsX_C5MQ","elasticsearch.node.name":"es01","elasticsearch.cluster.name":"docker-cluster","tags":[" [.kibana_ingest_8.11.0_001]"]}
2023-11-12 00:47:37 {"@timestamp":"2023-11-11T16:47:36.413Z", "log.level": "WARN", "message":"[gc][young][164][13] duration [1.1s], collections [1]/[1.2s], total [1.1s]/[5.5s], memory [250.4mb]->[117.2mb]/[2gb], all_pools {[young] [136mb]->[0b]/[0b]}{[old] [108.5mb]->[108.5mb]/[2gb]}{[survivor] [5.9mb]->[8.7mb]/[0b]}", "ecs.version": "1.2.0","service.name":"ES_ECS","event.dataset":"elasticsearch.server","process.thread.name":"elasticsearch[es01][scheduler][T#1]","log.logger":"org.elasticsearch.monitor.jvm.JvmGcMonitorService","elasticsearch.cluster.uuid":"3m-f4WNRREeLwEQNJDIbbQ","elasticsearch.node.id":"TMQPiSCqQeSMOiDsX_C5MQ","elasticsearch.node.name":"es01","elasticsearch.cluster.name":"docker-cluster"}
2023-11-12 00:47:38 {"@timestamp":"2023-11-11T16:47:36.671Z", "log.level": "WARN", "message":"[gc][164] overhead, spent [1.1s] collecting in the last [1.2s]", "ecs.version": "1.2.0","service.name":"ES_ECS","event.dataset":"elasticsearch.server","process.thread.name":"elasticsearch[es01][scheduler][T#1]","log.logger":"org.elasticsearch.monitor.jvm.JvmGcMonitorService","elasticsearch.cluster.uuid":"3m-f4WNRREeLwEQNJDIbbQ","elasticsearch.node.id":"TMQPiSCqQeSMOiDsX_C5MQ","elasticsearch.node.name":"es01","elasticsearch.cluster.name":"docker-cluster"}
2023-11-12 00:47:42 {"@timestamp":"2023-11-11T16:47:42.610Z", "log.level": "INFO", "message":"reloading search analyzers", "ecs.version": "1.2.0","service.name":"ES_ECS","event.dataset":"elasticsearch.server","process.thread.name":"elasticsearch[es01][generic][T#1]","log.logger":"org.elasticsearch.index.mapper.MapperService","elasticsearch.cluster.uuid":"3m-f4WNRREeLwEQNJDIbbQ","elasticsearch.node.id":"TMQPiSCqQeSMOiDsX_C5MQ","elasticsearch.node.name":"es01","elasticsearch.cluster.name":"docker-cluster","tags":[" [.transform-internal-007]"]}
2023-11-12 00:47:42 {"@timestamp":"2023-11-11T16:47:42.919Z", "log.level": "INFO", "message":"reloading search analyzers", "ecs.version": "1.2.0","service.name":"ES_ECS","event.dataset":"elasticsearch.server","process.thread.name":"elasticsearch[es01][generic][T#3]","log.logger":"org.elasticsearch.index.mapper.MapperService","elasticsearch.cluster.uuid":"3m-f4WNRREeLwEQNJDIbbQ","elasticsearch.node.id":"TMQPiSCqQeSMOiDsX_C5MQ","elasticsearch.node.name":"es01","elasticsearch.cluster.name":"docker-cluster","tags":[" [.kibana_analytics_8.11.0_001]"]}
2023-11-12 00:47:48 {"@timestamp":"2023-11-11T16:47:47.860Z", "log.level": "INFO", "message":"reloading search analyzers", "ecs.version": "1.2.0","service.name":"ES_ECS","event.dataset":"elasticsearch.server","process.thread.name":"elasticsearch[es01][generic][T#3]","log.logger":"org.elasticsearch.index.mapper.MapperService","elasticsearch.cluster.uuid":"3m-f4WNRREeLwEQNJDIbbQ","elasticsearch.node.id":"TMQPiSCqQeSMOiDsX_C5MQ","elasticsearch.node.name":"es01","elasticsearch.cluster.name":"docker-cluster","tags":[" [.apm-agent-configuration]"]}
2023-11-12 00:47:48 {"@timestamp":"2023-11-11T16:47:47.992Z", "log.level": "INFO", "message":"reloading search analyzers", "ecs.version": "1.2.0","service.name":"ES_ECS","event.dataset":"elasticsearch.server","process.thread.name":"elasticsearch[es01][generic][T#5]","log.logger":"org.elasticsearch.index.mapper.MapperService","elasticsearch.cluster.uuid":"3m-f4WNRREeLwEQNJDIbbQ","elasticsearch.node.id":"TMQPiSCqQeSMOiDsX_C5MQ","elasticsearch.node.name":"es01","elasticsearch.cluster.name":"docker-cluster","tags":[" [.apm-custom-link]"]}
2023-11-12 00:47:49 {"@timestamp":"2023-11-11T16:47:49.661Z", "log.level": "INFO", "message":"reloading search analyzers", "ecs.version": "1.2.0","service.name":"ES_ECS","event.dataset":"elasticsearch.server","process.thread.name":"elasticsearch[es01][generic][T#6]","log.logger":"org.elasticsearch.index.mapper.MapperService","elasticsearch.cluster.uuid":"3m-f4WNRREeLwEQNJDIbbQ","elasticsearch.node.id":"TMQPiSCqQeSMOiDsX_C5MQ","elasticsearch.node.name":"es01","elasticsearch.cluster.name":"docker-cluster","tags":[" [.transform-notifications-000002]"]}
2023-11-12 00:47:49 {"@timestamp":"2023-11-11T16:47:49.777Z", "log.level": "INFO", "message":"reloading search analyzers", "ecs.version": "1.2.0","service.name":"ES_ECS","event.dataset":"elasticsearch.server","process.thread.name":"elasticsearch[es01][generic][T#3]","log.logger":"org.elasticsearch.index.mapper.MapperService","elasticsearch.cluster.uuid":"3m-f4WNRREeLwEQNJDIbbQ","elasticsearch.node.id":"TMQPiSCqQeSMOiDsX_C5MQ","elasticsearch.node.name":"es01","elasticsearch.cluster.name":"docker-cluster","tags":[" [.ds-.logs-deprecation.elasticsearch-default-2023.11.11-000001]"]}
2023-11-12 00:47:52 {"@timestamp":"2023-11-11T16:47:52.049Z", "log.level": "INFO", "message":"reloading search analyzers", "ecs.version": "1.2.0","service.name":"ES_ECS","event.dataset":"elasticsearch.server","process.thread.name":"elasticsearch[es01][generic][T#4]","log.logger":"org.elasticsearch.index.mapper.MapperService","elasticsearch.cluster.uuid":"3m-f4WNRREeLwEQNJDIbbQ","elasticsearch.node.id":"TMQPiSCqQeSMOiDsX_C5MQ","elasticsearch.node.name":"es01","elasticsearch.cluster.name":"docker-cluster","tags":[" [.ds-ilm-history-5-2023.11.11-000001]"]}
2023-11-12 00:47:53 {"@timestamp":"2023-11-11T16:47:53.268Z", "log.level": "INFO", "message":"reloading search analyzers", "ecs.version": "1.2.0","service.name":"ES_ECS","event.dataset":"elasticsearch.server","process.thread.name":"elasticsearch[es01][generic][T#1]","log.logger":"org.elasticsearch.index.mapper.MapperService","elasticsearch.cluster.uuid":"3m-f4WNRREeLwEQNJDIbbQ","elasticsearch.node.id":"TMQPiSCqQeSMOiDsX_C5MQ","elasticsearch.node.name":"es01","elasticsearch.cluster.name":"docker-cluster","tags":[" [.internal.alerts-observability.threshold.alerts-default-000001]"]}
2023-11-12 00:47:55 {"@timestamp":"2023-11-11T16:47:55.224Z", "log.level": "INFO", "message":"reloading search analyzers", "ecs.version": "1.2.0","service.name":"ES_ECS","event.dataset":"elasticsearch.server","process.thread.name":"elasticsearch[es01][generic][T#1]","log.logger":"org.elasticsearch.index.mapper.MapperService","elasticsearch.cluster.uuid":"3m-f4WNRREeLwEQNJDIbbQ","elasticsearch.node.id":"TMQPiSCqQeSMOiDsX_C5MQ","elasticsearch.node.name":"es01","elasticsearch.cluster.name":"docker-cluster","tags":[" [.internal.alerts-observability.metrics.alerts-default-000001]"]}
2023-11-12 00:47:55 {"@timestamp":"2023-11-11T16:47:55.703Z", "log.level": "INFO", "message":"reloading search analyzers", "ecs.version": "1.2.0","service.name":"ES_ECS","event.dataset":"elasticsearch.server","process.thread.name":"elasticsearch[es01][generic][T#5]","log.logger":"org.elasticsearch.index.mapper.MapperService","elasticsearch.cluster.uuid":"3m-f4WNRREeLwEQNJDIbbQ","elasticsearch.node.id":"TMQPiSCqQeSMOiDsX_C5MQ","elasticsearch.node.name":"es01","elasticsearch.cluster.name":"docker-cluster","tags":[" [.internal.alerts-security.alerts-default-000001]"]}
2023-11-12 00:48:00 {"@timestamp":"2023-11-11T16:47:59.872Z", "log.level": "INFO", "message":"reloading search analyzers", "ecs.version": "1.2.0","service.name":"ES_ECS","event.dataset":"elasticsearch.server","process.thread.name":"elasticsearch[es01][generic][T#2]","log.logger":"org.elasticsearch.index.mapper.MapperService","elasticsearch.cluster.uuid":"3m-f4WNRREeLwEQNJDIbbQ","elasticsearch.node.id":"TMQPiSCqQeSMOiDsX_C5MQ","elasticsearch.node.name":"es01","elasticsearch.cluster.name":"docker-cluster","tags":[" [.slo-observability.summary-v2.temp]"]}
2023-11-12 00:48:02 {"@timestamp":"2023-11-11T16:48:02.403Z", "log.level": "WARN", "message":"[gc][young][188][14] duration [2.2s], collections [1]/[2.6s], total [2.2s]/[7.7s], memory [197.2mb]->[122.9mb]/[2gb], all_pools {[young] [80mb]->[0b]/[0b]}{[old] [108.5mb]->[108.5mb]/[2gb]}{[survivor] [8.7mb]->[14.4mb]/[0b]}", "ecs.version": "1.2.0","service.name":"ES_ECS","event.dataset":"elasticsearch.server","process.thread.name":"elasticsearch[es01][scheduler][T#1]","log.logger":"org.elasticsearch.monitor.jvm.JvmGcMonitorService","elasticsearch.cluster.uuid":"3m-f4WNRREeLwEQNJDIbbQ","elasticsearch.node.id":"TMQPiSCqQeSMOiDsX_C5MQ","elasticsearch.node.name":"es01","elasticsearch.cluster.name":"docker-cluster"}
2023-11-12 00:48:02 {"@timestamp":"2023-11-11T16:48:02.406Z", "log.level": "WARN", "message":"[gc][188] overhead, spent [2.2s] collecting in the last [2.6s]", "ecs.version": "1.2.0","service.name":"ES_ECS","event.dataset":"elasticsearch.server","process.thread.name":"elasticsearch[es01][scheduler][T#1]","log.logger":"org.elasticsearch.monitor.jvm.JvmGcMonitorService","elasticsearch.cluster.uuid":"3m-f4WNRREeLwEQNJDIbbQ","elasticsearch.node.id":"TMQPiSCqQeSMOiDsX_C5MQ","elasticsearch.node.name":"es01","elasticsearch.cluster.name":"docker-cluster"}
2023-11-12 00:48:02 {"@timestamp":"2023-11-11T16:48:02.577Z", "log.level": "INFO", "message":"reloading search analyzers", "ecs.version": "1.2.0","service.name":"ES_ECS","event.dataset":"elasticsearch.server","process.thread.name":"elasticsearch[es01][generic][T#2]","log.logger":"org.elasticsearch.index.mapper.MapperService","elasticsearch.cluster.uuid":"3m-f4WNRREeLwEQNJDIbbQ","elasticsearch.node.id":"TMQPiSCqQeSMOiDsX_C5MQ","elasticsearch.node.name":"es01","elasticsearch.cluster.name":"docker-cluster","tags":[" [.internal.alerts-observability.logs.alerts-default-000001]"]}
2023-11-12 00:48:07 {"@timestamp":"2023-11-11T16:48:07.841Z", "log.level": "INFO", "message":"reloading search analyzers", "ecs.version": "1.2.0","service.name":"ES_ECS","event.dataset":"elasticsearch.server","process.thread.name":"elasticsearch[es01][generic][T#2]","log.logger":"org.elasticsearch.index.mapper.MapperService","elasticsearch.cluster.uuid":"3m-f4WNRREeLwEQNJDIbbQ","elasticsearch.node.id":"TMQPiSCqQeSMOiDsX_C5MQ","elasticsearch.node.name":"es01","elasticsearch.cluster.name":"docker-cluster","tags":[" [.internal.alerts-ml.anomaly-detection.alerts-default-000001]"]}
2023-11-12 00:48:07 {"@timestamp":"2023-11-11T16:48:07.933Z", "log.level": "INFO", "message":"reloading search analyzers", "ecs.version": "1.2.0","service.name":"ES_ECS","event.dataset":"elasticsearch.server","process.thread.name":"elasticsearch[es01][generic][T#5]","log.logger":"org.elasticsearch.index.mapper.MapperService","elasticsearch.cluster.uuid":"3m-f4WNRREeLwEQNJDIbbQ","elasticsearch.node.id":"TMQPiSCqQeSMOiDsX_C5MQ","elasticsearch.node.name":"es01","elasticsearch.cluster.name":"docker-cluster","tags":[" [.internal.alerts-observability.uptime.alerts-default-000001]"]}
2023-11-12 00:48:09 {"@timestamp":"2023-11-11T16:48:09.123Z", "log.level": "INFO", "message":"reloading search analyzers", "ecs.version": "1.2.0","service.name":"ES_ECS","event.dataset":"elasticsearch.server","process.thread.name":"elasticsearch[es01][generic][T#3]","log.logger":"org.elasticsearch.index.mapper.MapperService","elasticsearch.cluster.uuid":"3m-f4WNRREeLwEQNJDIbbQ","elasticsearch.node.id":"TMQPiSCqQeSMOiDsX_C5MQ","elasticsearch.node.name":"es01","elasticsearch.cluster.name":"docker-cluster","tags":[" [.internal.alerts-observability.apm.alerts-default-000001]"]}
2023-11-12 00:48:09 {"@timestamp":"2023-11-11T16:48:09.200Z", "log.level": "INFO", "message":"reloading search analyzers", "ecs.version": "1.2.0","service.name":"ES_ECS","event.dataset":"elasticsearch.server","process.thread.name":"elasticsearch[es01][generic][T#6]","log.logger":"org.elasticsearch.index.mapper.MapperService","elasticsearch.cluster.uuid":"3m-f4WNRREeLwEQNJDIbbQ","elasticsearch.node.id":"TMQPiSCqQeSMOiDsX_C5MQ","elasticsearch.node.name":"es01","elasticsearch.cluster.name":"docker-cluster","tags":[" [.apm-source-map]"]}
2023-11-12 00:48:10 {"@timestamp":"2023-11-11T16:48:10.709Z", "log.level": "INFO", "message":"reloading search analyzers", "ecs.version": "1.2.0","service.name":"ES_ECS","event.dataset":"elasticsearch.server","process.thread.name":"elasticsearch[es01][generic][T#6]","log.logger":"org.elasticsearch.index.mapper.MapperService","elasticsearch.cluster.uuid":"3m-
2023-11-12 00:56:07
2023-11-12 00:56:07 ERROR: Elasticsearch exited unexpectedly, with exit code 137