Hi All,
So When I am trying to plot the values of one field with different value for each tag(Please find attached the image of table)
For example:
I have a field called "Pack_state" which has several string values like 'BMU_State_Powerdown', 'BMU_State_Standby'..and so on. For each value in field Pack_State i want to plot the numeric value of that string i.e. for BMU_State_Standby I want to plot numeric value 3 under field called "Value".
I am able to plot this in Kibana using Lucene syntax in the script:
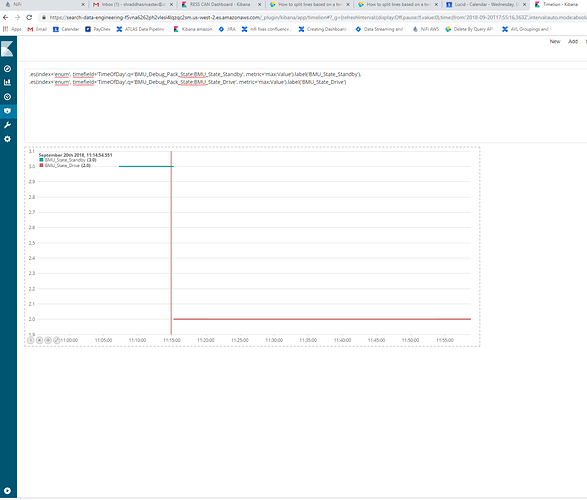
.es(index='enum', timefield='TimeOfDay',q='BMU_Debug_Pack_State:BMU_State_Standby', metric='max:Value').label('BMU_State_Standby'),
.es(index='enum', timefield='TimeOfDay',q='BMU_Debug_Pack_State:BMU_State_Drive', metric='max:Value').label('BMU_State_Drive')
(In the above picture you can see the value for BMU_State_Drive starts showing much much before it actually should) HOW TO SOLVE THIS ? WHAT REGEX SHOULD I USE?
I am able to achieve the numeric values(2,3,4,...) with the string as its label using lucene syntax in kibana (as i have shared above the script for Timelion) but the problem is at one timestamp(i.e. 11:15:54.551) it shows me 2 numeric values for both the strings, However if u look at the image 'BMU_State_Drive' (the red line) value does not even start at that time but still displaying the numeric value thereby confusing the people viewing the dashboard. I guess it the bucket size issue as kibana doesnt find any data points to show it retains the last value and display that untill at a new timestamp it finds a new value.(I am not sure why its showing this behavior).
I hope I was able to clear myself. Let me know if it's still not clear. Please help. Thank You in advance 


