Configuration environment: es-7.17.8 kibana-7.17.8 filebeat-7.17.8
(Elasticsearch is a single node, and the data mount point is the efs file system of AWS)
Problem Description:
I started to find that kibanan was in use. When searching for the load, there was a prompt that some shards could not be loaded. Check the index.
It was found that some indexes were in red, and the indexes of some machines in the last two days were not collected into es normally.
Start restarting es, and the machines that have not collected the index are still unable to collect normally. Then we check and find that the number of primary and secondary shards of the index is 1.
Then configure the number of index shards as primary 1 and secondary 0. The yellow index becomes green, and the red index remains red.
The status of elasticsearch is still red, and there is always the number of shards of unassigned_shards.
Restarting elasticsearch several times still fails to convert the number of shards in unassigned_shards to the number of shards in the active_shards state.
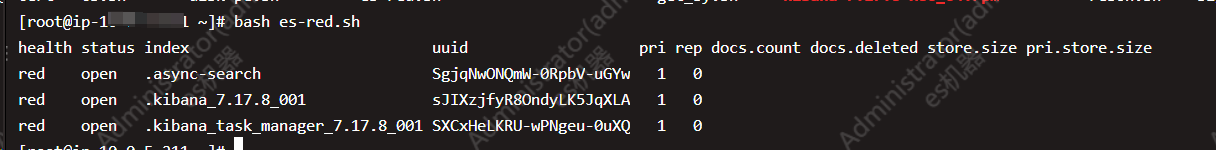
Reinstalled kibanan many times (operation process: stop kibanan, delete kibanan related indexes in elasticsearch, reinstall kibanan)
The final status of elasticsearch and kibanan is as shown in the figure