Hi guys , i'm working on a project where i need to check absence and presence of employees , my index has 5 fields(MAT,NAME,DATE,PRESENCE(1or 0),ABSENCE(1 or 0)) it contains the data of the presence and absence of employees everyday , so my goal is to show in a metric visualization if a person is always present during the period selected in the time filter , i managed to make a unique count based on name feld and filter on presence eq 1 and absence eq 0 but it gives all the possible data and i need to check if his present the whole time .
any idea what should i do ?
any suggestion would be appreciated because i'm stuck here
thanks in advance.
ELK 7.4.0
Hi @haythem,
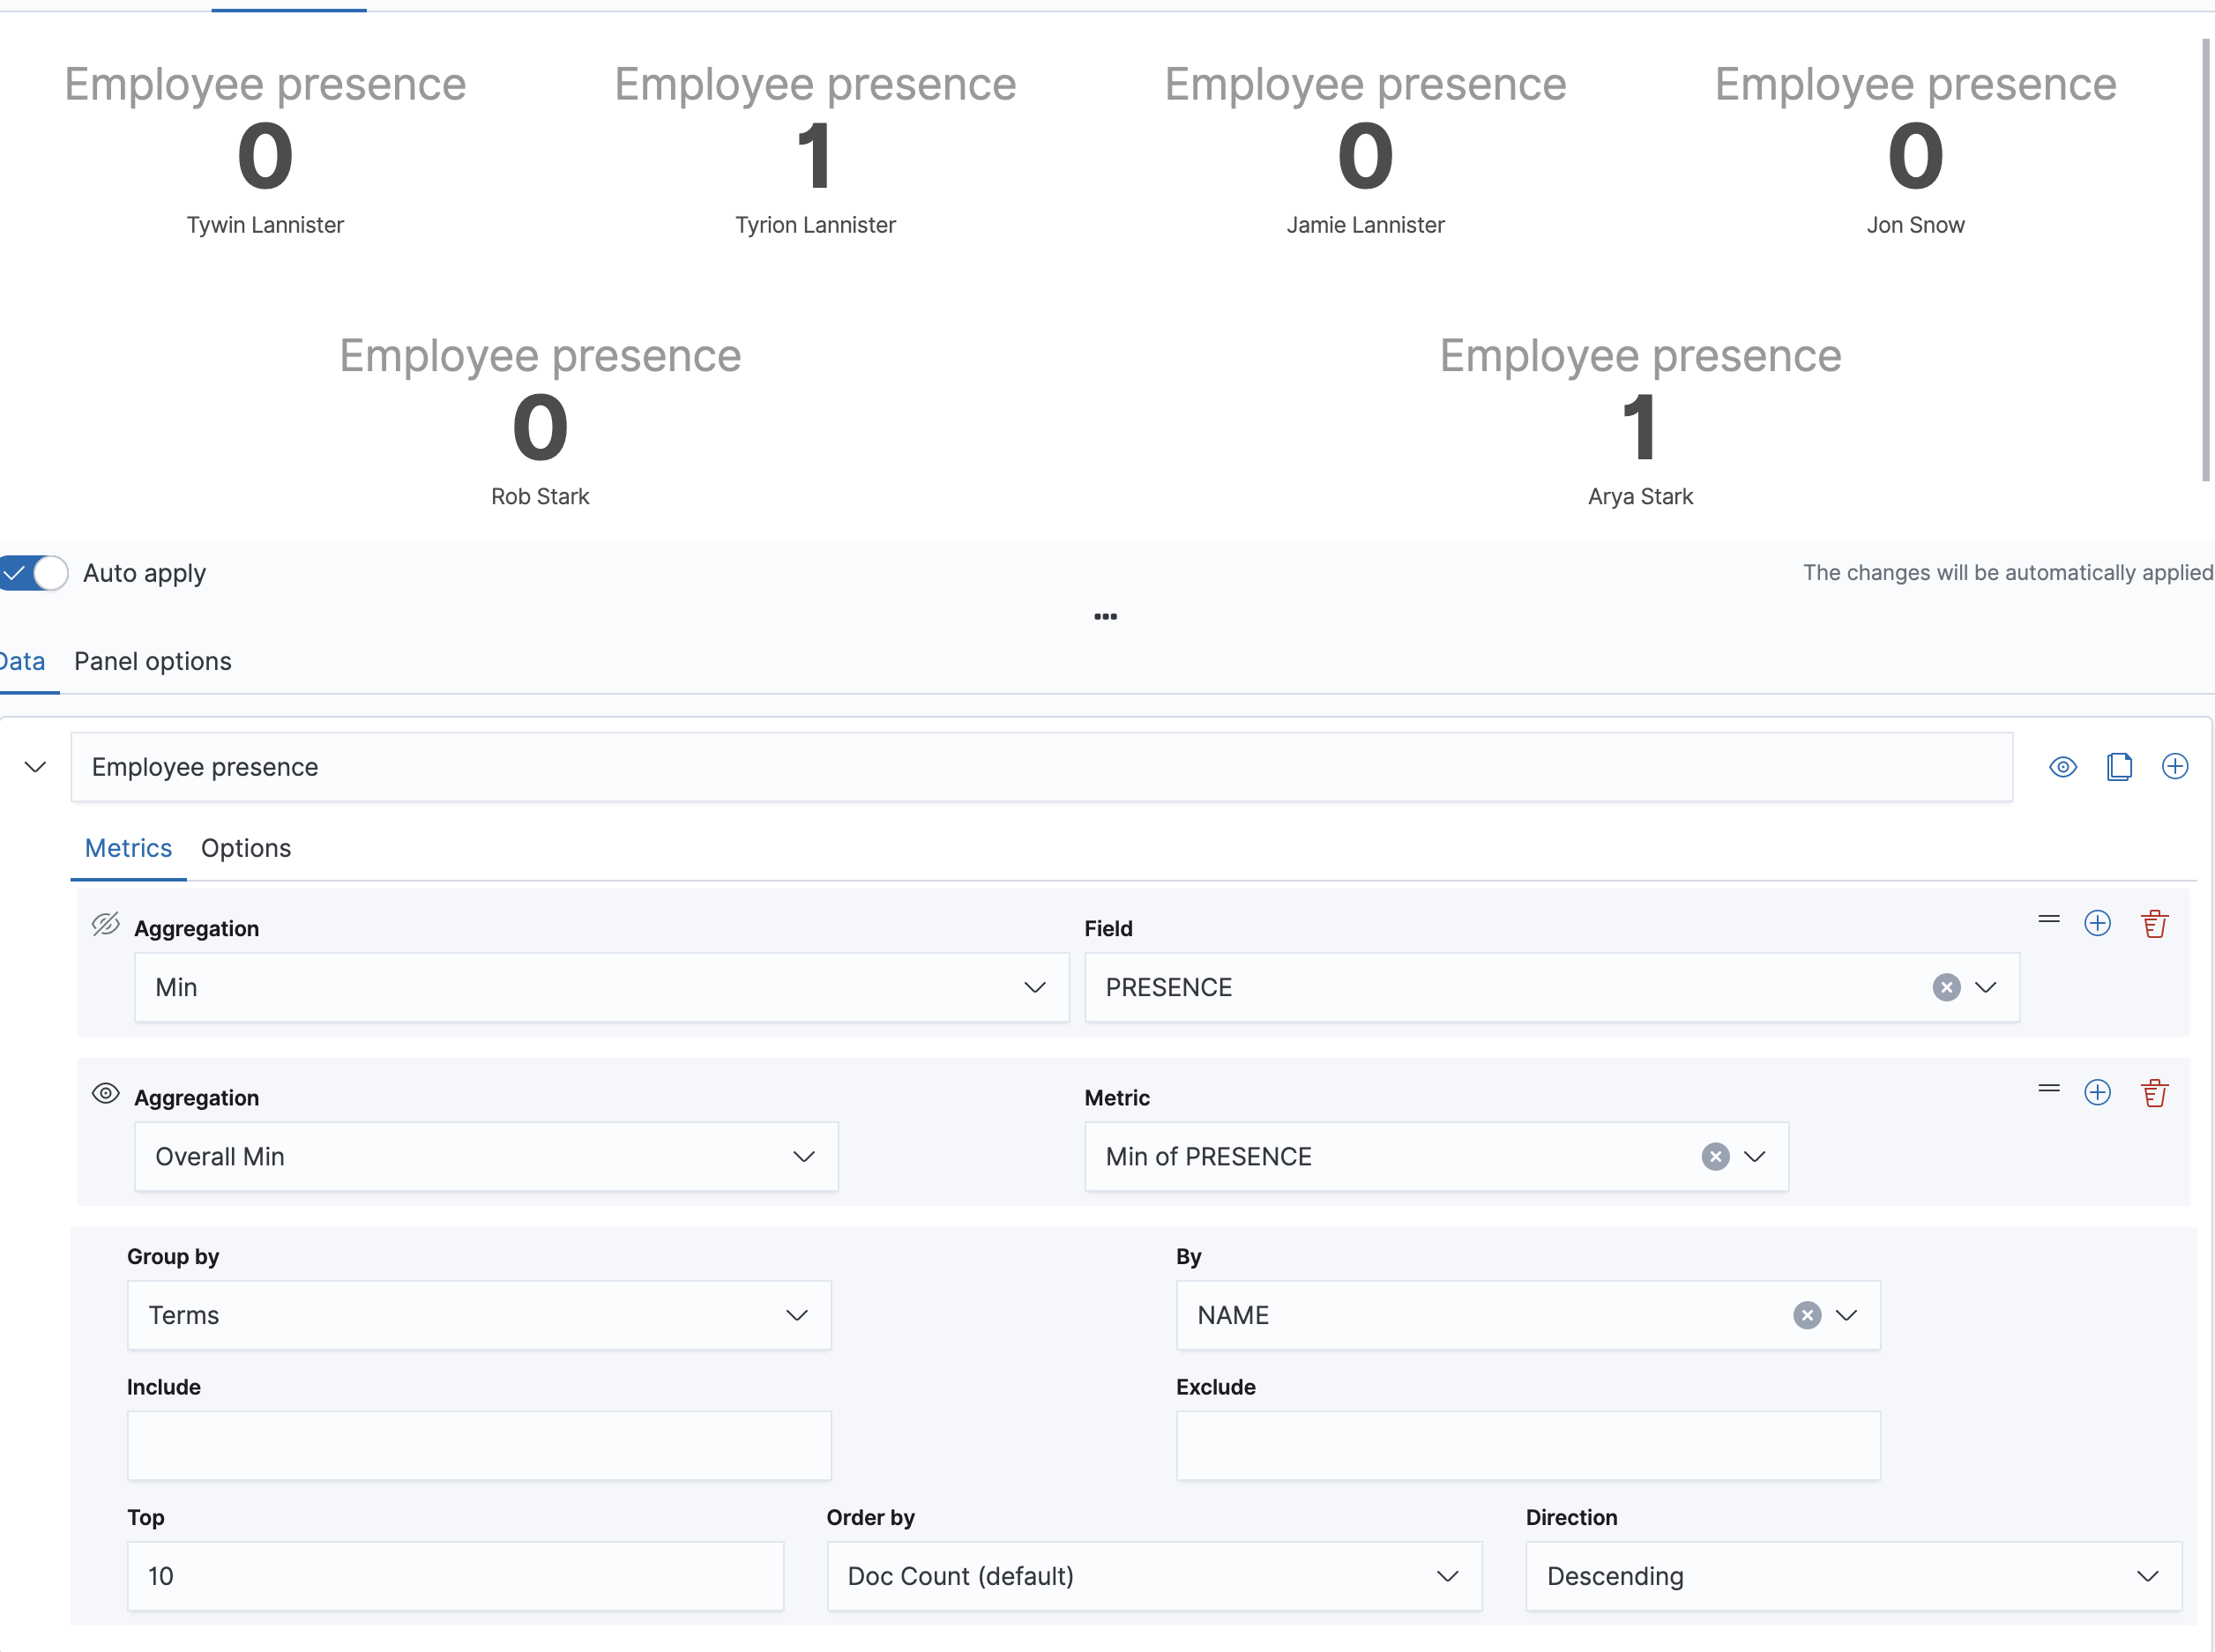
you can achieve it in TSVB with a bit of workaround. In 'Panel options' tab, set up interval on your index pattern for 1d. Then, in data tab, configure following metrics:
- Min of PRESENCE
- Overall Min of Presence - if the employee was present all the time, it will return 1. If they were absent, it will return 0.
- group it by Terms, by the field name.
Here's the configured data tab:
Hope it helps!
Marta
@Marta_Bondyra thank you so much , it works 
@Marta_Bondyra i have another question , is it possible to count all the absent or present employees in TSVB ?
Glad it helped!
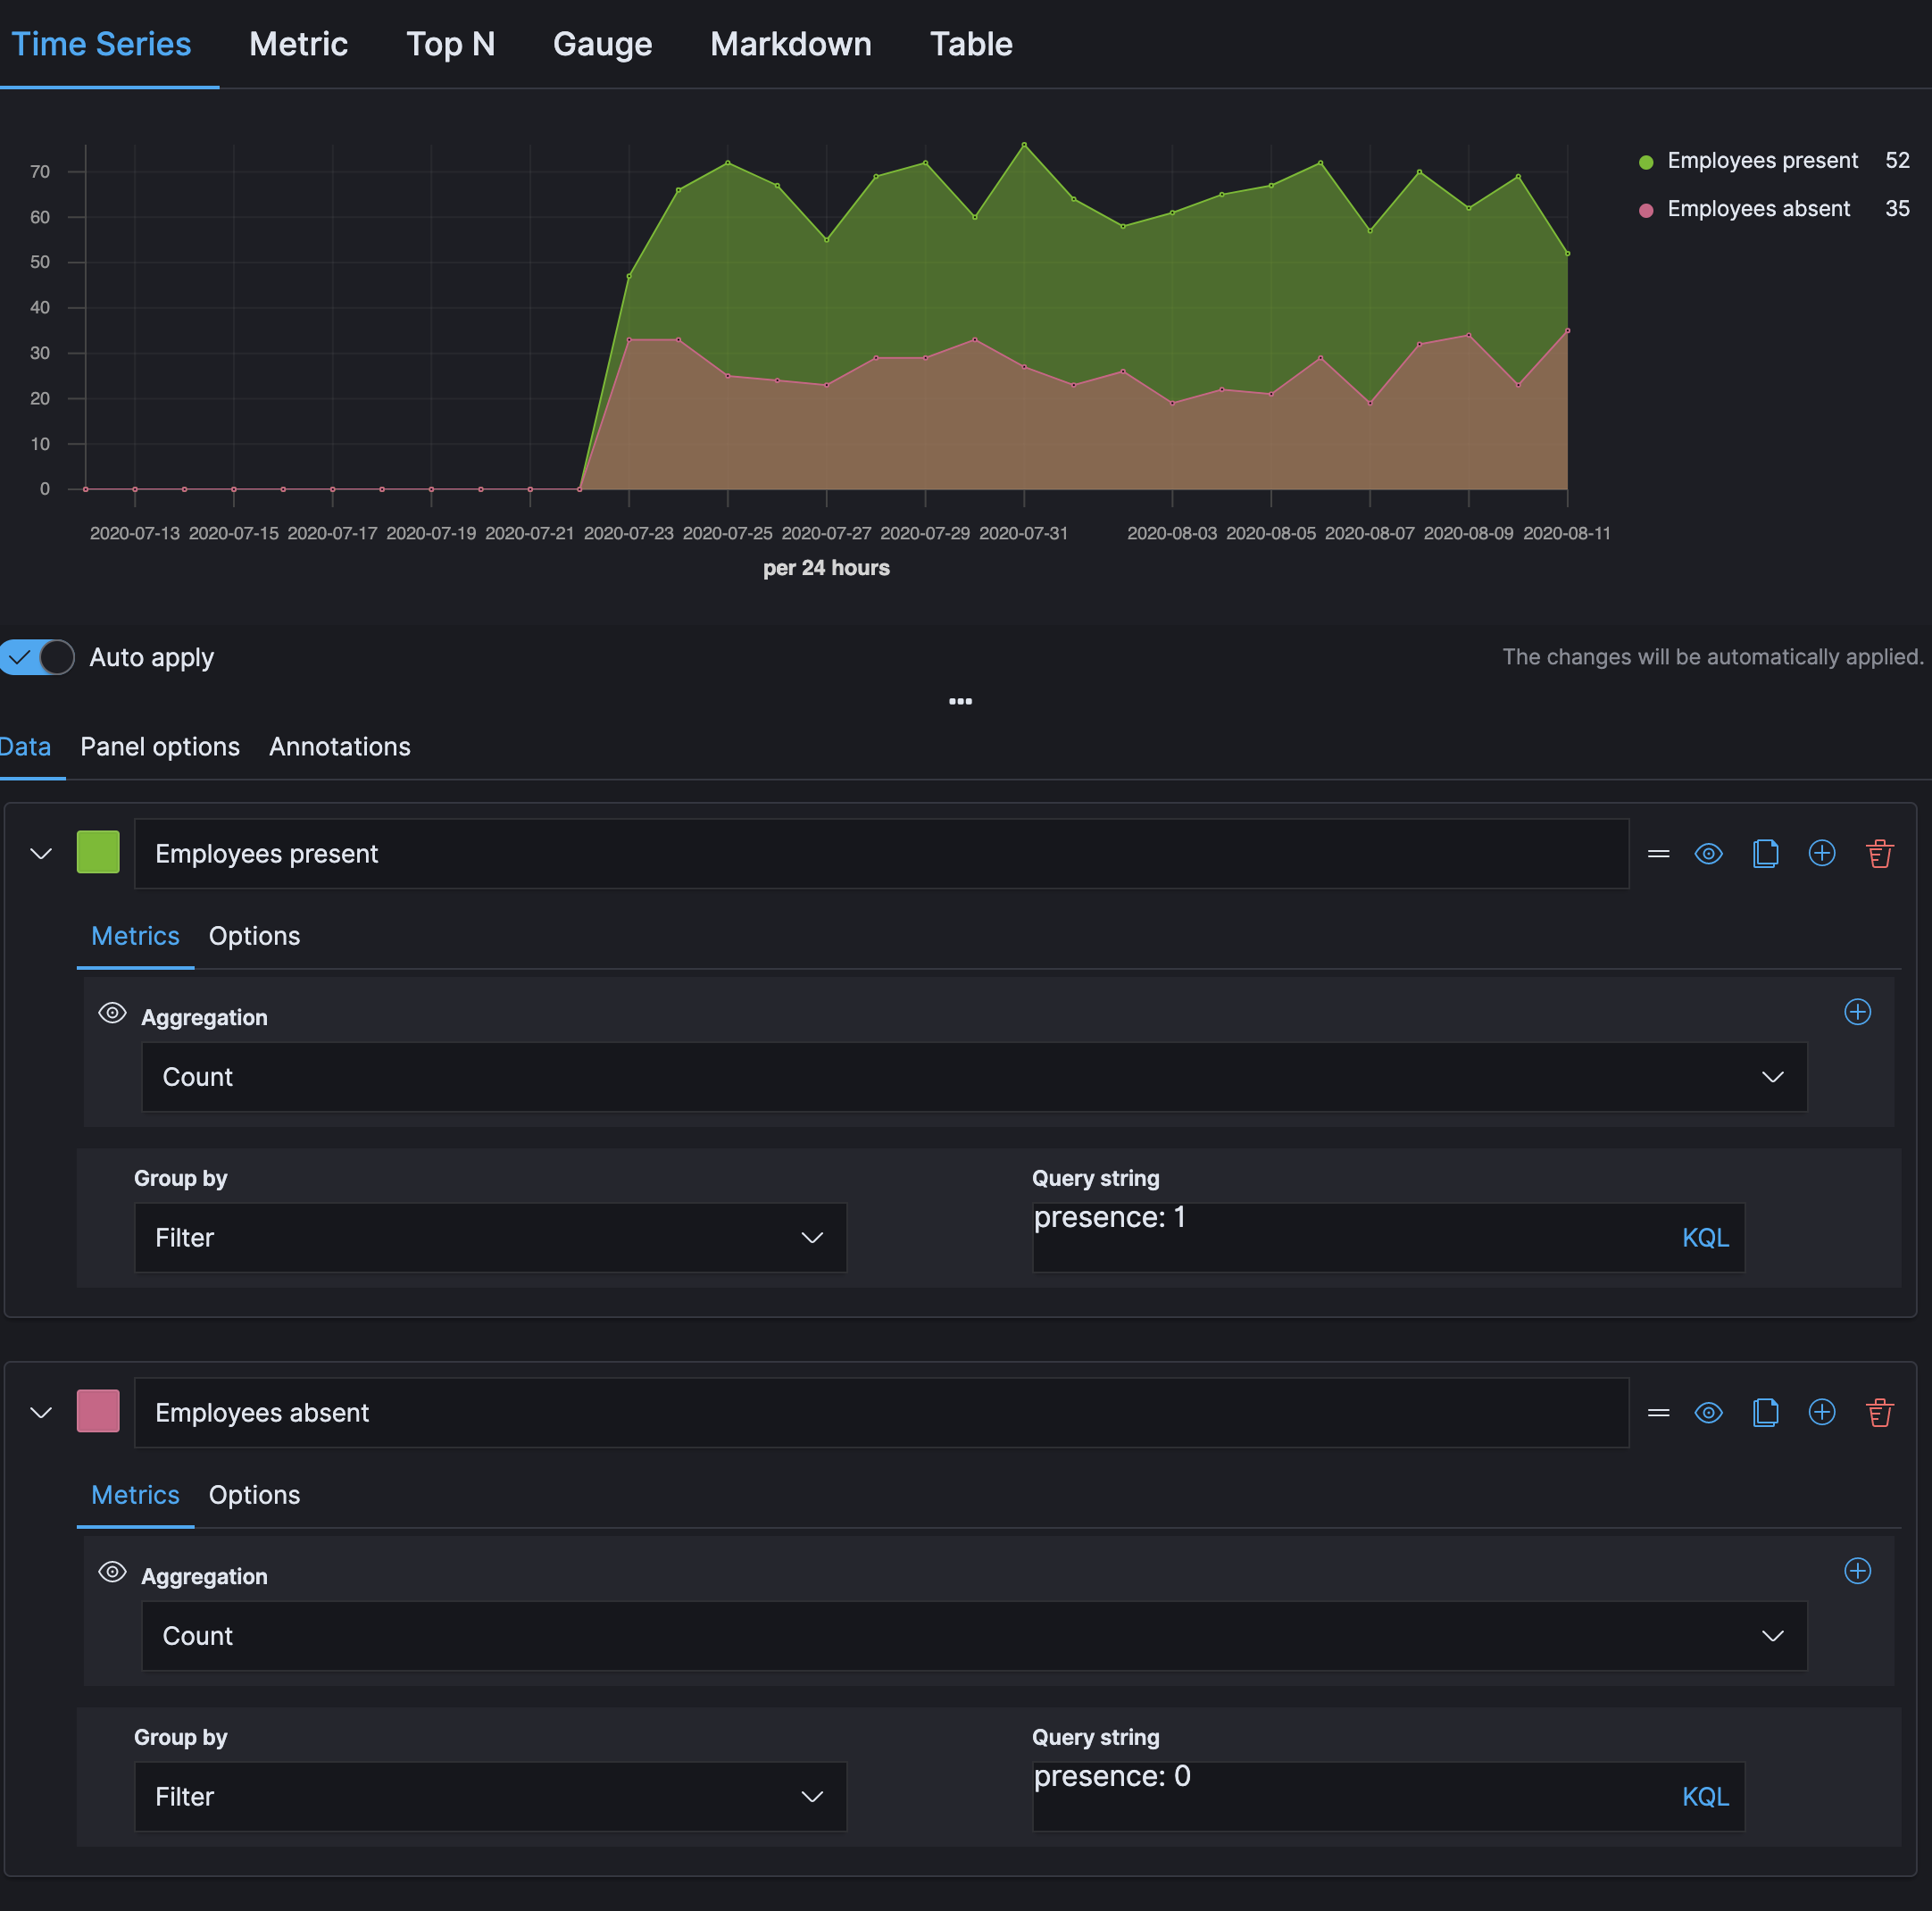
@haythem do you mean count all present employees day by day? Or all the employees that were present in the selected period without single absence?
For day by day, the solution would be to selected interval 1d just like above and then create two filtered count metrics:
For the selected period of time, it looks more complicated and I am not sure if we can achieve it with TSVB - we need to calculate overall min for each employee separately and after the breakdown count the '1's. Let me know if day by day is enough. Otherwise I think Vega is the way to go