When I apply filter to the Line chart in Kibana, the filter value is displayed as a title at the axis but as two identical lines.
How can I make it display only one line? E.g. "filter_value:filters"
metricbeat.yml
metricbeat.modules:
- module: system
  metricsets: ["core", "cpu", "load", "memory"]
  enabled: true
  period: 10s
  processes: ['.*']
  cpu_ticks: false
output.elasticsearch:
  hosts: ["elasticsearch_server__name:9200"]
Also, the heap size in Kibana is always around 200Mb; How can I increase that number if I run Kibana with Docker?
Hello,
For the first problem a issue was raised in Github and the fix was merged in 5.4.1. You can see the PR here: https://github.com/elastic/kibana/pull/11594
As for the second one, you'd have to pass the JAVA_OPTS='-Xmx1g' (this is just an example) when doing docker run.
By the way, is it possible to change the font size of values on "Metric" widgets?
Also, coming back to my original question. I passed JAVA_OPTS='-Xmx3g' in Docker command and in "Monitoring" section JVM Heap shows 3GB but then I again can see lower values for total heap ~120Mb (check the screenshot).
What is the reason?
Kibana will increase the heap automatically when it needs, but it's usually around that size for a normal workload. It doesn't make sense to increase the heap to more until it's needed.
As for the Metric widgets are you talking about the metric visualization? If so, then you can find a Font Size slider in the Options menu of the visualization.
If you're talking about the metrics in the status and monitoring pages of kibana, you can only use the zoom feature from your browser (usually CTRL + Scroll Up/Down)
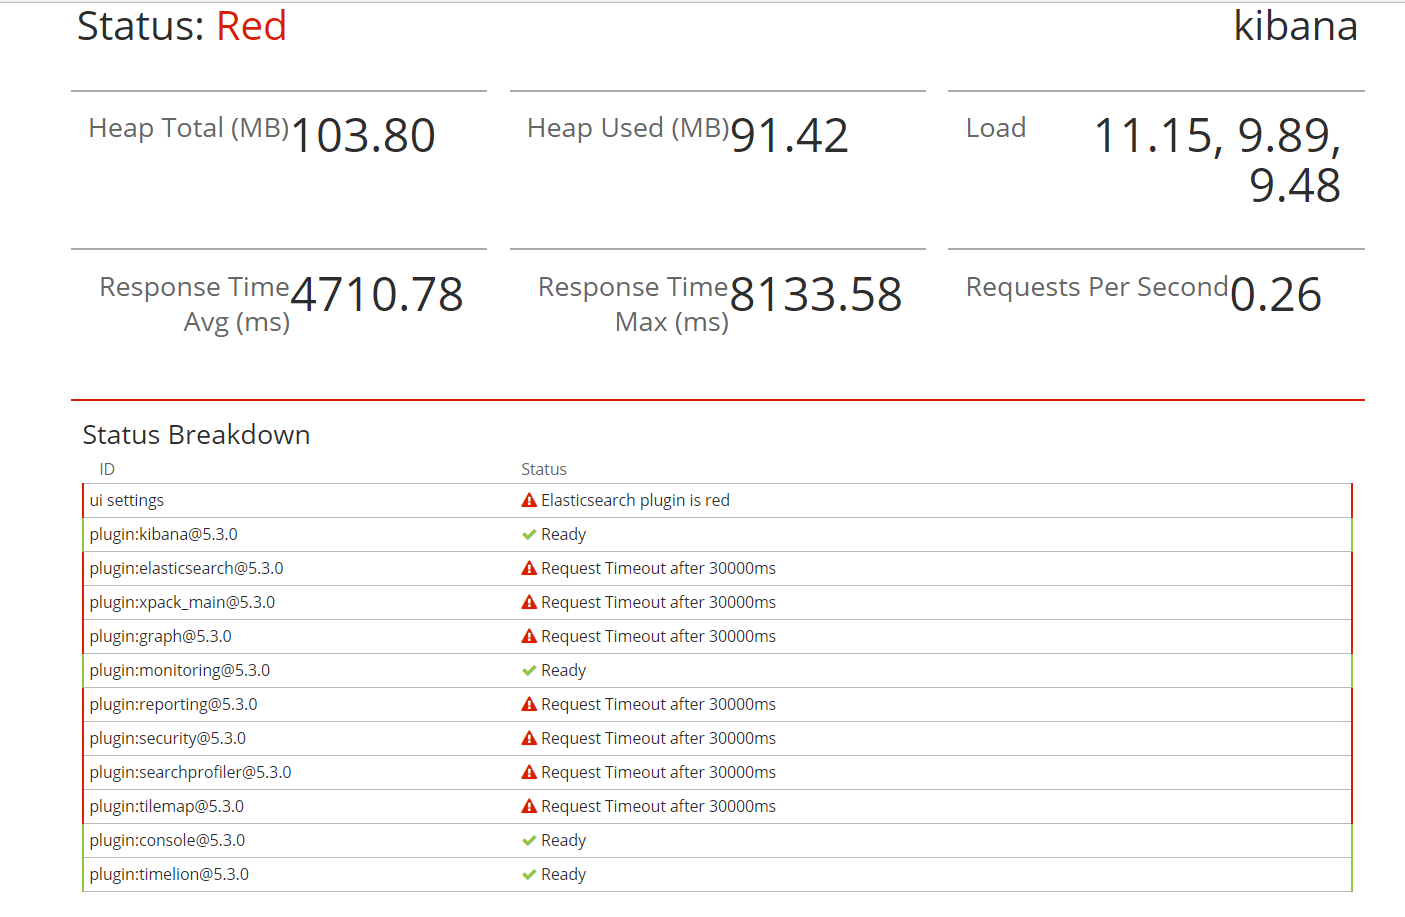
Thanks. And the status above became red most-likely because of Elasticsearch, correct?
Yes, either ES or a plugin. There usually is a list below that and it should show you what "plugin" is Red (Elasticsearch is considered a plugin in that list too)
Usually it shows this. Looks like something wrong with plugins?
It just looks like there's a connectivity issue between Kibana and ES. The plugins are shown as red as they cannot query ES for information.
Ok, thanks. Can I ask a side question:
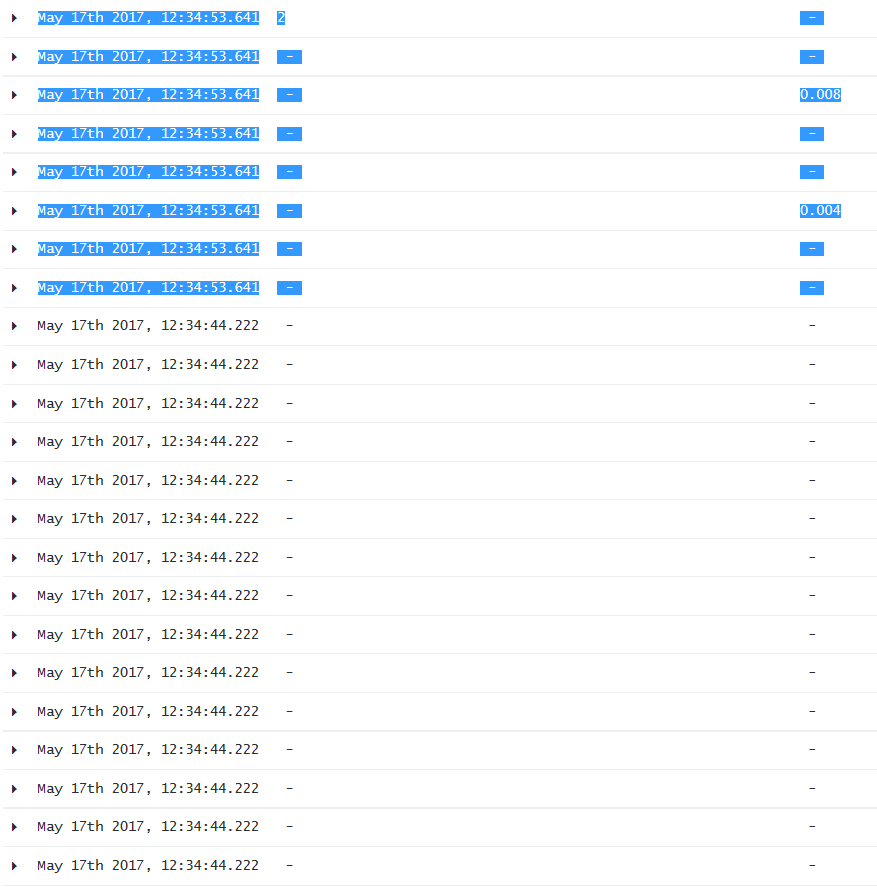
I am using Metricbeat to collect system info every 10 seconds. But when I try to display all such info messages in Kibana, I can see multiple records (both empty and non-empty) with exactly the same timestamps.
Is it expected or it's a Kibana issue?
Check the type of those document. Some of them are for different types of metricsets. As you can see inside the metricbeat.yml file, there are a few of them: cpu, filesystem, fsstat, memory, network, process, etc. Some of them will have the field that you have pinned there, some won't. If you're looking for something specific, try to filter only in the metricset that your info is in.
This is how you do it: you expand the document, look for the look for one document with the metricset that you want and you click on the magnifying glass with th + sybol in it to show only documents with that value for that field.
Thanks. But what could be the reason in connectivity problem between ES and Kibana?
Also, Kibana works extremely slow.