https://lh4.googleusercontent.com/-wPnUFalDo9k/UqvhRyTRTZI/AAAAAAAAADk/KOjfVUUflT8/s1600/Screen+Shot+2013-12-13+at+9.38.59+PM.png
I am new to Kibana and I would like to create a frequency graph based on 2
fields in elasticsearch.
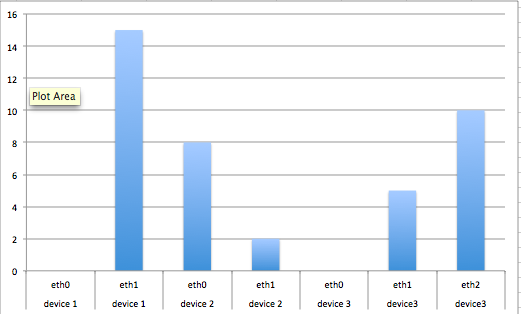
I have 3 devices stashing records into elasticsearch. Each device cuts a
record when a network interface hits a threshold. What I would like to do
is graph something like this mockup which is using the fields "interface"
and "hostname" from each record. It's simple accumulative counting.
Once I get the basic graph working at some point it would like to morph it
into graphing accumulations within a given time period (1m, 5m, 10m, etc.)
Is this possible with Kibana?
--
You received this message because you are subscribed to the Google Groups "elasticsearch" group.
To unsubscribe from this group and stop receiving emails from it, send an email to elasticsearch+unsubscribe@googlegroups.com.
To view this discussion on the web visit https://groups.google.com/d/msgid/elasticsearch/212b1f05-025c-421d-bcd2-24c3360b0e70%40googlegroups.com.
For more options, visit https://groups.google.com/groups/opt_out.