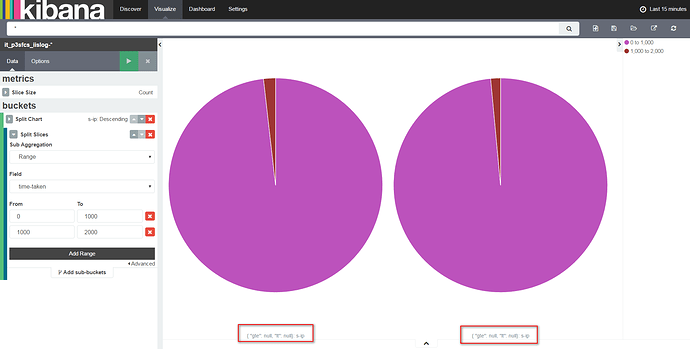
My ELK is logstash 2.1.3, elasticsearch 2.2.1,kibana 4.4.2.
I transfer windows Server 2008 R2 IIS log to ELK,and create pie chart in kibana,
I select "s-ip" field as "split chart",then select "time-taken" field(type:number) as "split Slices", "Range" as the "Sub Aggreagation",then generate the "pie chart",but then pie chart name is
{ "gte": null, "lt": null}: s-ip, not the correct "s-ip" field values. ( marked in red rectangle in the following snapshot)
how can I resolve it ? thanks .
