Hi
I have set up Elasticsearch and Kibana according to this page
Everything was working fine for about one day. Then suddenly the graphs in Kibana started to display straight line. Data is still seen in Kibana -> Discover tab. New records appear normally. Only the graphs are broken.
I have tried to recreate the graphs (visualize, timelion, dashboard). Same thing with new graphs.
In other words: the graphs (old and new) work for the duration of approx 24 hours when the setup was first build (last week). After this only straight line. For example if there was e.g. a cron job to input the data to "graph engine" this job would have failed and "graph engine" only has access to data for the first 24 hours.
I have rebooted the server multiple times. I have not found anything special in the logs.
Where to look further, what could I do to troubleshoot? Commands, log files, etc?
There's plenty of free disk space.
Thanks
Hello,
Can you give us some more information about your ES and Kibana setup? From what I can see in that guide, it requires ES 1.x (which is EOL) and Kibana 4.1.x.
These are not supported any longer, but I can try helping if you have some more details and screenshots.
Thank you,
Marius
Thanks.
This is a fresh install of ES and Kibana. It's running on debian 9 and installed using following "official" packages: elasticsearch-5.5.1.deb and kibana-5.5.1-amd64.deb (fetched from https://artifacts.elastic.co/downloads/ ...)
Single node. Nothing else running on the same virtual server.
The same sflow data is fed to another system which is working fine so I assume there's nothing wrong with sflow originator.
I have attached a few example screenshots that illustrate the broken graphs and data viewed with "discover".
Sflow is sampled 1:1000 and values have been "normalized" using pmacct w/following config. This has not changed when the problem started.
sfacctd_ext_sampling_rate: 1000
sfacctd_renormalize: true
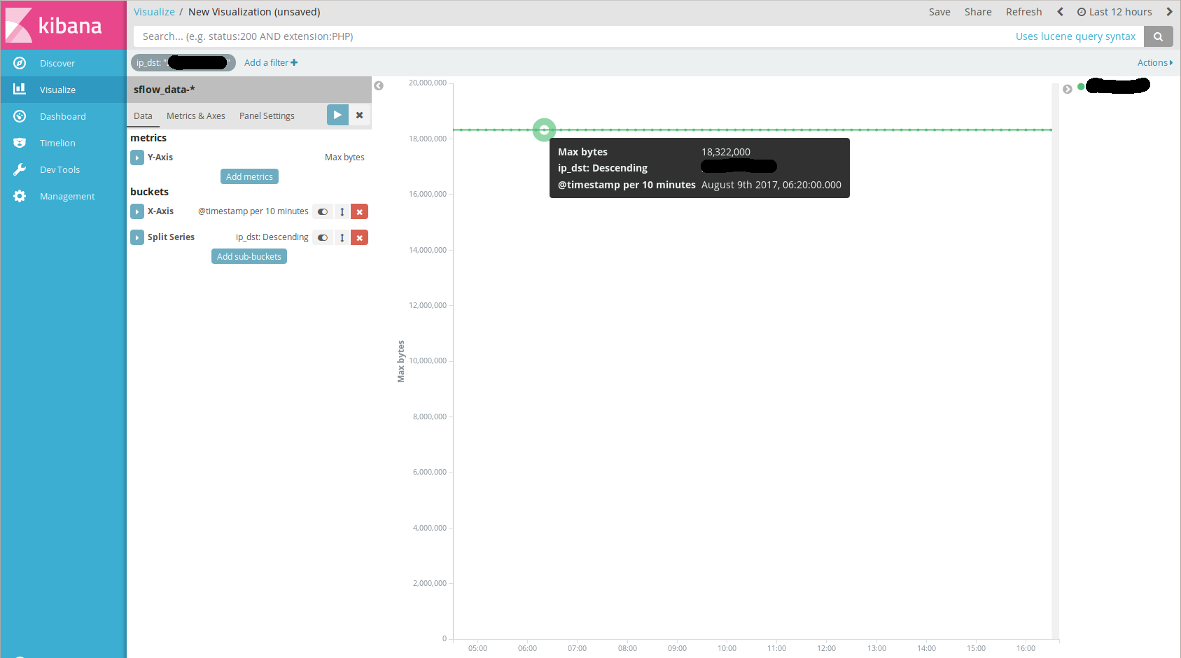
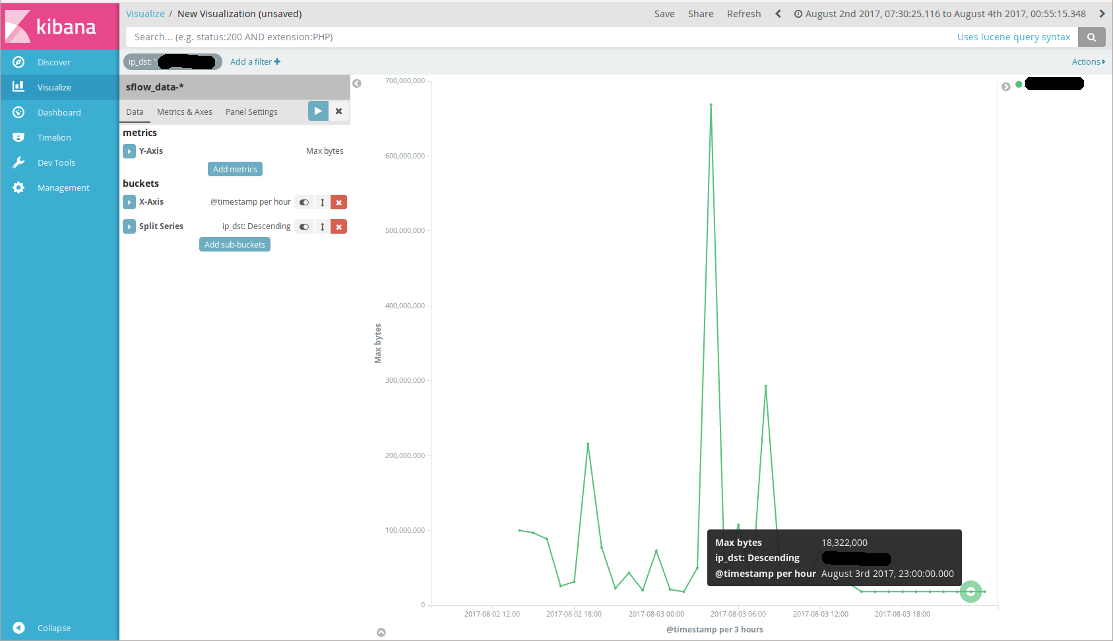
In screenshots 3, 4 and 5 the filtered ip_dst is same and is just an example. Hovering the mouse over line displays the same "max bytes: 18,332,000" wherever the line is straight, i.e. after approx 2017-08-03 14:00. The behaviour is same for every ip_dst but the value is different. Same for packets and bytes. It does not matter if I select max, average or sum for the aggregation. The shape of line changes but after the same timestamp the line is straight.
It's like some storage has become full and no new data is accepted to graphs. But I have no clue where to search.
My goal is to graph different things with different filters. It appeared to work in the beginning but no more 
screenshot 1
screenshot 2
screenshot 3
screenshot 4
screenshot 5