Kibana scatter Plot

Hi Guys,

I am trying to have a crack at creating a vega graph from our database. However, for some reason there is is no error in the code but there aren't! If anyone can see if I am missing anything? I've been scratching my head on this one. Thanks in advance!

{
$schema: https://vega.github.io/schema/vega-lite/v2.json
data: {
# URL object is a context-aware query to Elasticsearch
url: {
# The %-enclosed keys are handled by Kibana to modify the query
# before it gets sent to Elasticsearch. Context is the search
# filter as shown above the dashboard. Timefield uses the value
# of the time picker from the upper right corner.
%context%: true
%timefield%: timestamp
index: revitproject-0.0.4*
body: {
size: 10000
_source: ["timestamp", "action.duration", "action.name"]
}
}
# We only need the content of hits.hits array
format: {property: "hits.hits"}
}

Parse timestamp into a javascript date value

transform: [
{calculate: "toDate(datum._source['timestamp'])", as: "time"}
]

Draw a circle, with x being the time field, and y - number of bytes

mark: circle
encoding: {
x: {field: "time", type: "temporal"}
y: {field: "_source.action.duration", type: "quantitative"}
}
}

2019-11-15_1049|690x372

any displays?

Ok so I have been, working through the issue line by line and it turns out it might have to with _source.action.duration

at first, I thought it might have been the index formatting so I changed that to duration format in as second and format output as seconds ... but I still get the same issues.

Hi @cookie,

Could you follow the steps outlined in this document for your current state: https://gist.github.com/nyurik/736c34970ba3c32f3fe3d45d66719b3e

And attach the results here?

It will inline the data coming from Elasticsearch which makes troubleshooting easier.

hi @flash1293 Joe, Thanks for that tip it does help. I hope the below helps clarify what I am trying to do.

"{"$schema":"https://vega.github.io/schema/vega/v3.json","autosize":{"type":"fit","contains":"padding"},"padding":5,"style":"cell","data":[{"name":"source_0","values":{"took":2,"timed_out":false,"_shards":{"total":1,"successful":1,"skipped":0,"failed":0},"hits":{"total":{"value":2,"relation":"eq"},"max_score":1,"hits":[{"_index":"revitproject-0.0.4-2019.11","_type":"_doc","_id":"bFlmkm4BdVGWrfNJAFdx","_score":1,"_source":{"action.duration":6.633500799999999,"action.name":"Open","timestamp":"2019-11-22T09:16:21.1461782Z"}},{"_index":"revitproject-0.0.4-2019.11","_type":"_doc","_id":"DFqckm4BdVGWrfNJYo9D","_score":1,"_source":{"action.duration":3570.8098565,"action.name":"Closing","timestamp":"2019-11-22T10:15:51.5320006Z"}}]}},"format":{"property":"hits.hits"}},{"name":"data_0","source":"source_0","transform":[{"type":"formula","expr":"toNumber(datum["_source"] && datum["_source"]["action"] && datum["_source"]["action"]["duration"])","as":"_source.action.duration"},{"type":"formula","expr":"toDate(datum._source['timestamp'])","as":"time"},{"type":"filter","expr":"datum["time"] !== null && !isNaN(datum["time"]) && datum["_source.action.duration"] !== null && !isNaN(datum["_source.action.duration"])"}]}],"marks":[{"name":"marks","type":"symbol","style":["circle"],"from":{"data":"data_0"},"encode":{"update":{"opacity":{"value":0.7},"fill":{"value":"#00B3A4"},"x":{"scale":"x","field":"time"},"y":{"scale":"y","field":"_source\.action\.duration"},"shape":{"value":"circle"}}}}],"scales":[{"name":"x","type":"time","domain":{"data":"data_0","field":"time"},"range":[0,{"signal":"width"}]},{"name":"y","type":"linear","domain":{"data":"data_0","field":"_source\.action\.duration"},"range":[{"signal":"height"},0],"nice":true,"zero":true}],"axes":[{"scale":"x","orient":"bottom","grid":false,"title":"time","labelFlush":true,"labelOverlap":true,"tickCount":{"signal":"ceil(width/40)"},"zindex":1},{"scale":"x","orient":"bottom","grid":true,"tickCount":{"signal":"ceil(width/40)"},"gridScale":"y","domain":false,"labels":false,"maxExtent":0,"minExtent":0,"ticks":false,"zindex":0},{"scale":"y","orient":"left","grid":false,"title":"_source.action.duration","labelOverlap":true,"tickCount":{"signal":"ceil(height/40)"},"zindex":1},{"scale":"y","orient":"left","grid":true,"tickCount":{"signal":"ceil(height/40)"},"gridScale":"x","domain":false,"labels":false,"maxExtent":0,"minExtent":0,"ticks":false,"zindex":0}],"config":{"axisY":{"minExtent":30},"range":{"category":{"scheme":"elastic"}}}}"

Hi @cookie,

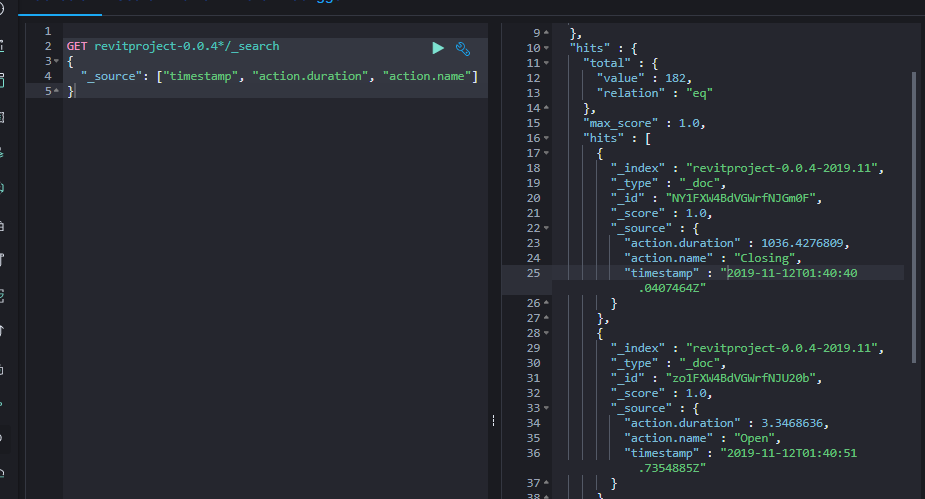
The problem is that the value you need is in _source['action.duration'] - that's not the same as _source.action.duration because there is a difference that is easy to miss - the first one looks for a key action.duration in the _source object, the second one for a key duration in the action object in the _source object. For the shape of your data you need the first variant.

I changed your script a bit and it shows two points for me:

{
  "$schema": "https://vega.github.io/schema/vega/v3.json",
  "width": 500,
  "height": 500,
  "padding": 5,
  "style": "cell",
  "data": [
    {
      "name": "source_0",
      "values": {
        "took": 2,
        "timed_out": false,
        "_shards": {"total": 1, "successful": 1, "skipped": 0, "failed": 0},
        "hits": {
          "total": {"value": 2, "relation": "eq"},
          "max_score": 1,
          "hits": [
            {
              "_index": "revitproject-0.0.4-2019.11",
              "_type": "_doc",
              "_id": "bFlmkm4BdVGWrfNJAFdx",
              "_score": 1,
              "_source": {
                "action.duration": 6.633500799999999,
                "action.name": "Open",
                "timestamp": "2019-11-22T09:16:21.1461782Z"
              }
            },
            {
              "_index": "revitproject-0.0.4-2019.11",
              "_type": "_doc",
              "_id": "DFqckm4BdVGWrfNJYo9D",
              "_score": 1,
              "_source": {
                "action.duration": 3570.8098565,
                "action.name": "Closing",
                "timestamp": "2019-11-22T10:15:51.5320006Z"
              }
            }
          ]
        }
      },
      "format": {"property": "hits.hits"}
    },
    {
      "name": "data_0",
      "source": "source_0",
      "transform": [
        {
          "type": "formula",
          "expr": "toNumber(datum._source['action.duration'])",
          "as": "duration"
        },
        {
          "type": "formula",
          "expr": "toDate(datum._source['timestamp'])",
          "as": "time"
        },
        {
          "type": "filter",
          "expr": "datum['time'] !== null && !isNaN(datum['time']) && datum['duration'] !== null && !isNaN(datum['duration'])"
        }
      ]
    }
  ],
  "marks": [
    {
      "name": "marks",
      "type": "symbol",
      "style": ["circle"],
      "from": {"data": "data_0"},
      "encode": {
        "update": {
          "opacity": {"value": 0.7},
          "fill": {"value": "#00B3A4"},
          "x": {"scale": "x", "field": "time"},
          "y": {"scale": "y", "field": "duration"},
          "shape": {"value": "circle"}
        }
      }
    }
  ],
  "scales": [
    {
      "name": "x",
      "type": "time",
      "domain": {"data": "data_0", "field": "time"},
      "range": [0, {"signal": "width"}]
    },
    {
      "name": "y",
      "type": "linear",
      "domain": {"data": "data_0", "field": "duration"},
      "range": [{"signal": "height"}, 0],
      "nice": true,
      "zero": true
    }
  ],
  "axes": [
    {
      "scale": "x",
      "orient": "bottom",
      "grid": false,
      "title": "time",
      "labelFlush": true,
      "labelOverlap": true,
      "tickCount": {"signal": "ceil(width/40)"},
      "zindex": 1
    },
    {
      "scale": "x",
      "orient": "bottom",
      "grid": true,
      "tickCount": {"signal": "ceil(width/40)"},
      "gridScale": "y",
      "domain": false,
      "labels": false,
      "maxExtent": 0,
      "minExtent": 0,
      "ticks": false,
      "zindex": 0
    },
    {
      "scale": "y",
      "orient": "left",
      "grid": false,
      "title": "_source.action.duration",
      "labelOverlap": true,
      "tickCount": {"signal": "ceil(height/40)"},
      "zindex": 1
    },
    {
      "scale": "y",
      "orient": "left",
      "grid": true,
      "tickCount": {"signal": "ceil(height/40)"},
      "gridScale": "x",
      "domain": false,
      "labels": false,
      "maxExtent": 0,
      "minExtent": 0,
      "ticks": false,
      "zindex": 0
    }
  ],
  "config": {
    "axisY": {"minExtent": 30},
    "range": {"category": {"scheme": "elastic"}}
  }
}

This topic was automatically closed 28 days after the last reply. New replies are no longer allowed.