run the java application (refer Lab 5.2: Services Layer of the Lab Guide: Elastic Observability Engineer
The following error is encountered and Kibana shows no data in APM for
INFO PetClinicApplication - Started PetClinicApplication in 27.884 seconds (JVM running for 58.674)
2021-02-04 02:00:44.057 [elastic-apm-server-reporter] ERROR co.elastic.apm.agent.report.IntakeV2ReportingEventHandler - Failed to handle event of type METRICS with this error: Connection refused (Connection refused)
2021-02-04 02:00:44.057 [elastic-apm-server-reporter] INFO co.elastic.apm.agent.report.IntakeV2ReportingEventHandler - Backing off for 1 seconds (+/-10%)
2021-02-04 02:01:14.059 [elastic-apm-server-reporter] ERROR co.elastic.apm.agent.report.IntakeV2ReportingEventHandler - Failed to handle event of type METRICS with this error: Connection refused (Connection refused)
I don't know (nor can access) this lab environment, but you should be able to find help in the troubleshooting section of our documentation.
This kind of error often appears when Kibana / APM server / Elasticsearch is not running, thus maybe if Elasticsearch was running on the same host your pkill command also terminated Elasticsearch process.
HI Sylvan,
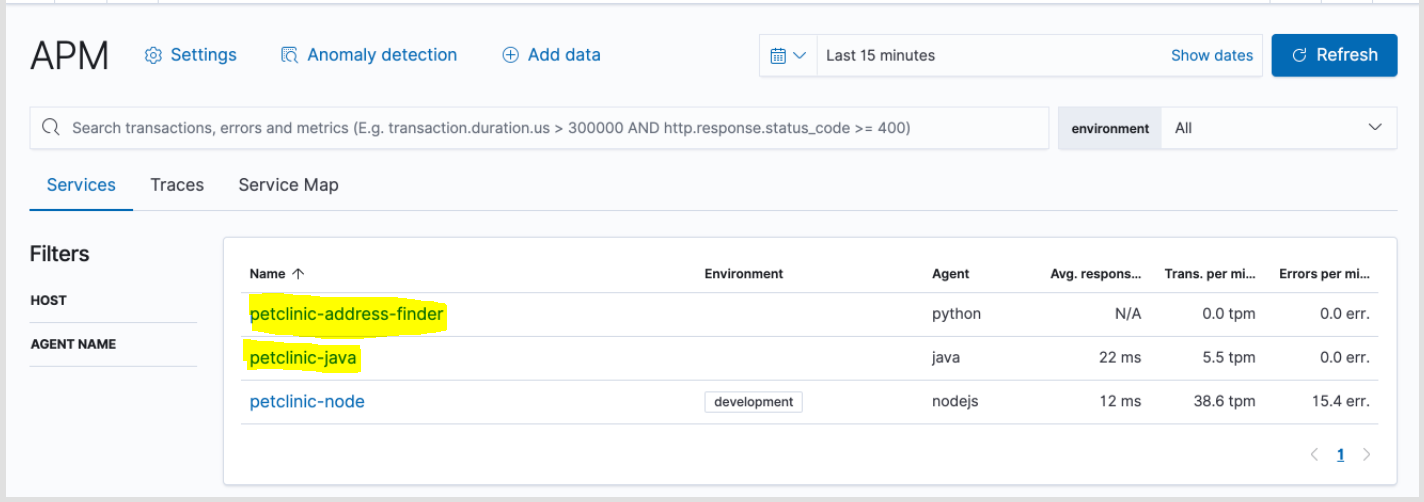
I had Elasticsearch and Kibana working at the time; no issues. However, as stated in the tutorial I followed the steps to view the data in Kibana-APM, I could only view the petclinic-node. I was not able to view the petclicnic-java and even the petclinic-address-finder links as stated in training (shown below).
Seems like the connection was broken or not allowed. Anyone in Infra you can check there with?
Apache, Apache Lucene, Apache Hadoop, Hadoop, HDFS and the yellow elephant
logo are trademarks of the
Apache Software Foundation
in the United States and/or other countries.